7.7. Hypothesis Tests for One Population Mean When \(\sigma\) Is Known#
When conducting hypothesis tests involving a single population mean, the procedure varies based on whether the population standard deviation (\(\sigma\)) is known. This section outlines the procedure for cases where \(\sigma\) is known, utilizing the z-test to evaluate hypotheses about the population mean.
Algorithm 7.1 (Hypothesis Tests for One Population Mean with Known Standard Deviation)
Objective: To conduct a hypothesis test for the population mean (\(\mu\)).
Prerequisites:
A simple random sample is obtained.
The population is normally distributed or the sample size is sufficiently large.
The population standard deviation (\(\sigma\)) is known.
Method:
Define the Significance Level: Choose the significance level (\(\alpha\)).
State the Hypotheses:
Two-Tailed Test:
Null Hypothesis: \(H_0: \mu = \mu_{0}\)
Alternative Hypothesis: \(H_a: \mu \neq \mu_{0}\)
Left-Tailed Test:
Null Hypothesis: \(H_0: \mu \geq \mu_{0}\)
Alternative Hypothesis: \(H_a: \mu < \mu_{0}\)
Right-Tailed Test:
Null Hypothesis: \(H_0: \mu \leq \mu_{0}\)
Alternative Hypothesis: \(H_a: \mu > \mu_{0}\)
Calculate the Test Statistic: Use the formula:
(7.14)#\[\begin{equation} Z = \dfrac{\overline{x} - \mu_{0}}{\dfrac{\sigma}{\sqrt{n}}} \end{equation}\]Determine Critical Value(s):
For two-tailed tests: \(\pm z_{\alpha/2}\)
For left-tailed tests: \(-z_{\alpha}\)
For right-tailed tests: \(z_{\alpha}\)
Decision Rule:
Critical-Value Approach:
If the test statistic falls within the rejection region, reject \(H_0\); otherwise, do not reject \(H_0\).
P-value Approach:
Calculate the P-value using the test statistic.
Reject \(H_0\) if \(P \leq \alpha\); otherwise, do not reject \(H_0\).
This algorithm outlines the steps to perform a hypothesis test for a population mean when the population standard deviation is known. Following this structured approach ensures consistency and rigor in hypothesis testing, leading to valid conclusions about the population mean.
Example 7.27
A company claims that their new battery lasts longer than the current industry standard of 500 hours. To test this claim, a random sample of 16 batteries was tested, and the following lifespans (in hours) were recorded:
At the 5% significance level, do the data provide sufficient evidence to conclude that the mean battery lifespan is greater than the industry standard of 500 hours? Assume that the population standard deviation of battery lifespans is 15 hours.
Solution:
Hypothesis Test:
Null Hypothesis (\(H_0\)): \(\mu \leq 500\) hours
Alternative Hypothesis (\(H_a\)): \(\mu > 500\) hours
Sample Statistics:
\(n = 16\)
\(\sigma = 15\) hours
\(\overline{x} = 508.750\) hours (calculated as the mean of the sample data)
Significance Level: \(\alpha = 0.05\)
Test Statistic:
Critical-Value Approach:
Critical value: \(z_{\alpha} = z_{0.05} = 1.645\)
Since \(\text{Test Statistic} = 2.33 > z_{0.05} = 1.645\), reject \(H_0\).
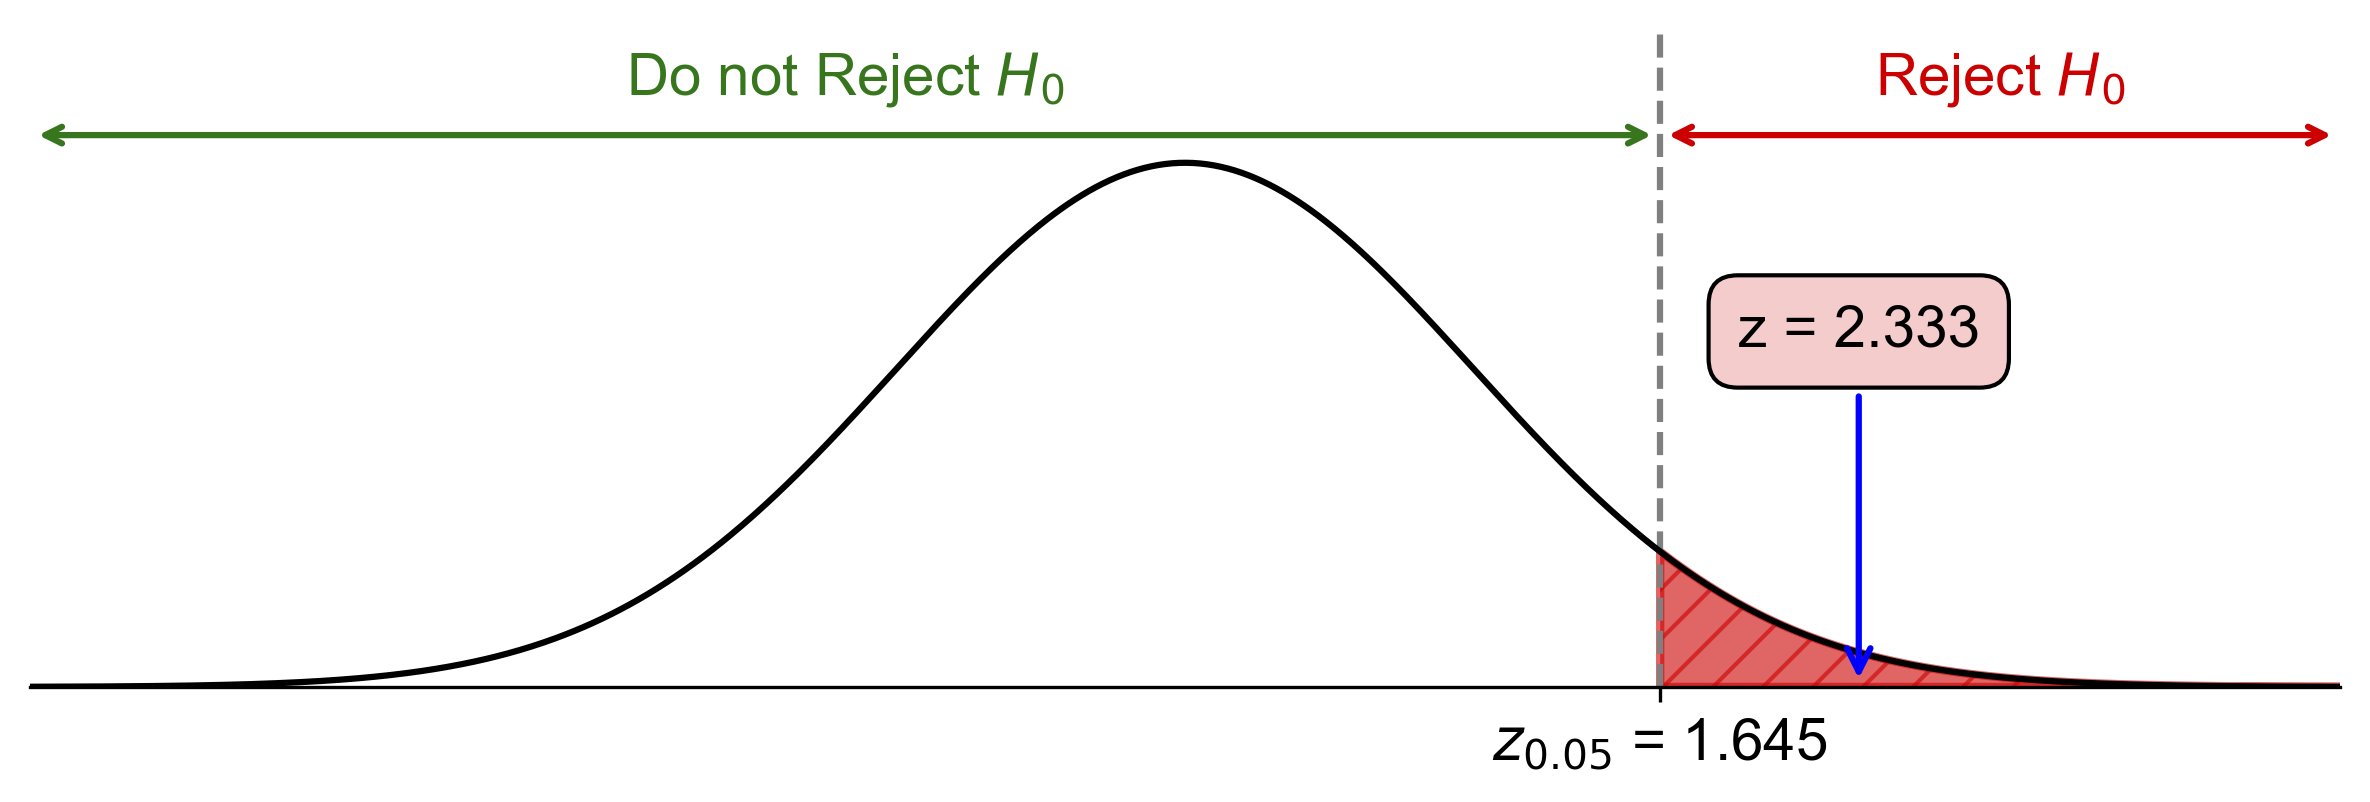
Fig. 7.24 Critical-value approach demonstrating the rejection region for Example 7.27.#
P-Value Approach:
P-value: \(P(Z > 2.33) \approx 0.0098\)
Since \(\text{P-value} = 0.0098 < \alpha = 0.05\), reject \(H_0\).
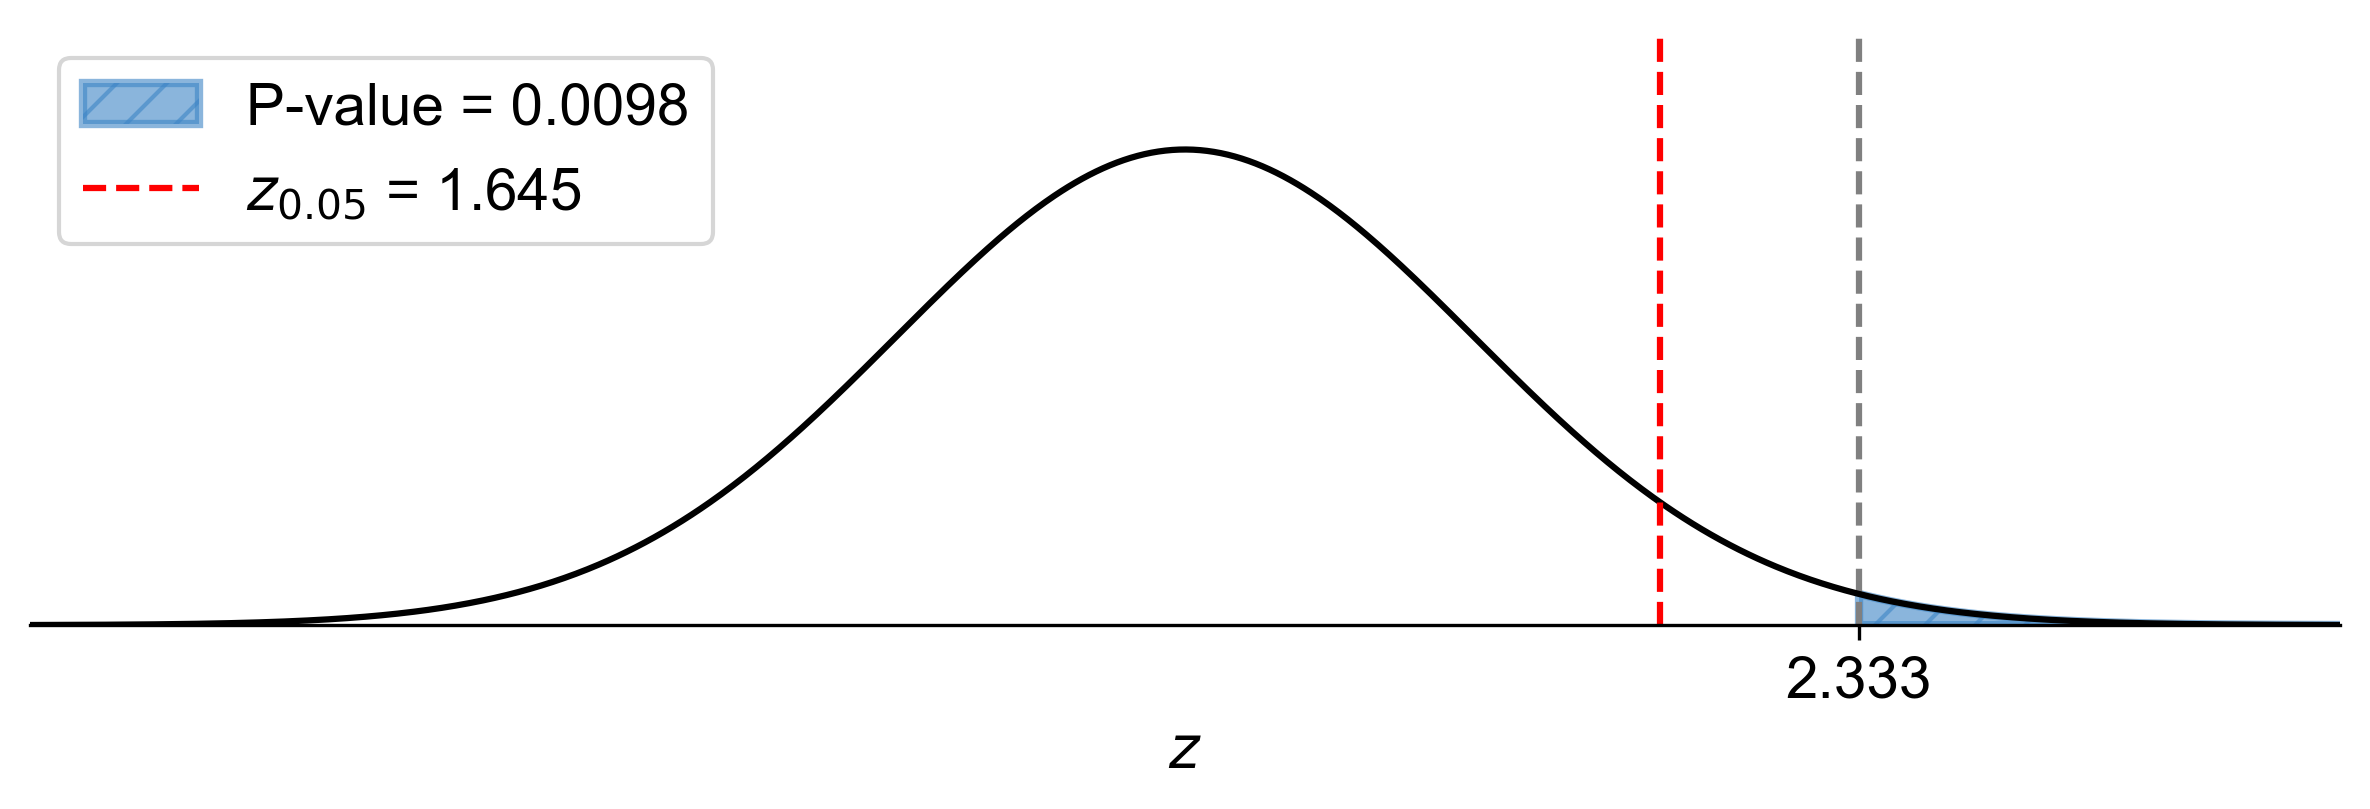
Fig. 7.25 P-value approach illustrating the significance of the test statistic for Example 7.27.#
At the 5% significance level, the data provide sufficient evidence to conclude that the mean battery lifespan is greater than 500 hours.
Example 7.28
A nutritionist claims that a new diet plan helps people lose more than 5 pounds in a month. To test this claim, a random sample of 20 individuals followed the diet plan for a month, and their weight losses (in pounds) were recorded as follows:
At the 5% significance level, do the data provide sufficient evidence to conclude that the mean weight loss is greater than 5 pounds? Assume that the population standard deviation of weight losses is 0.7 pounds.
Solution:
Hypothesis Test:
Null Hypothesis (\(H_0\)): \(\mu \leq 5\) pounds
Alternative Hypothesis (\(H_a\)): \(\mu > 5\) pounds
Sample Statistics:
\(n = 20\)
\(\sigma = 0.7\) pounds
\(\overline{x} = 5.55\) pounds (calculated as the mean of the sample data)
Significance Level: \(\alpha = 0.05\)
Test Statistic:
Critical-Value Approach:
Critical value: \(z_{\alpha} = z_{0.05} = 1.645\)
Since \(3.51 > 1.645\), reject \(H_0\).
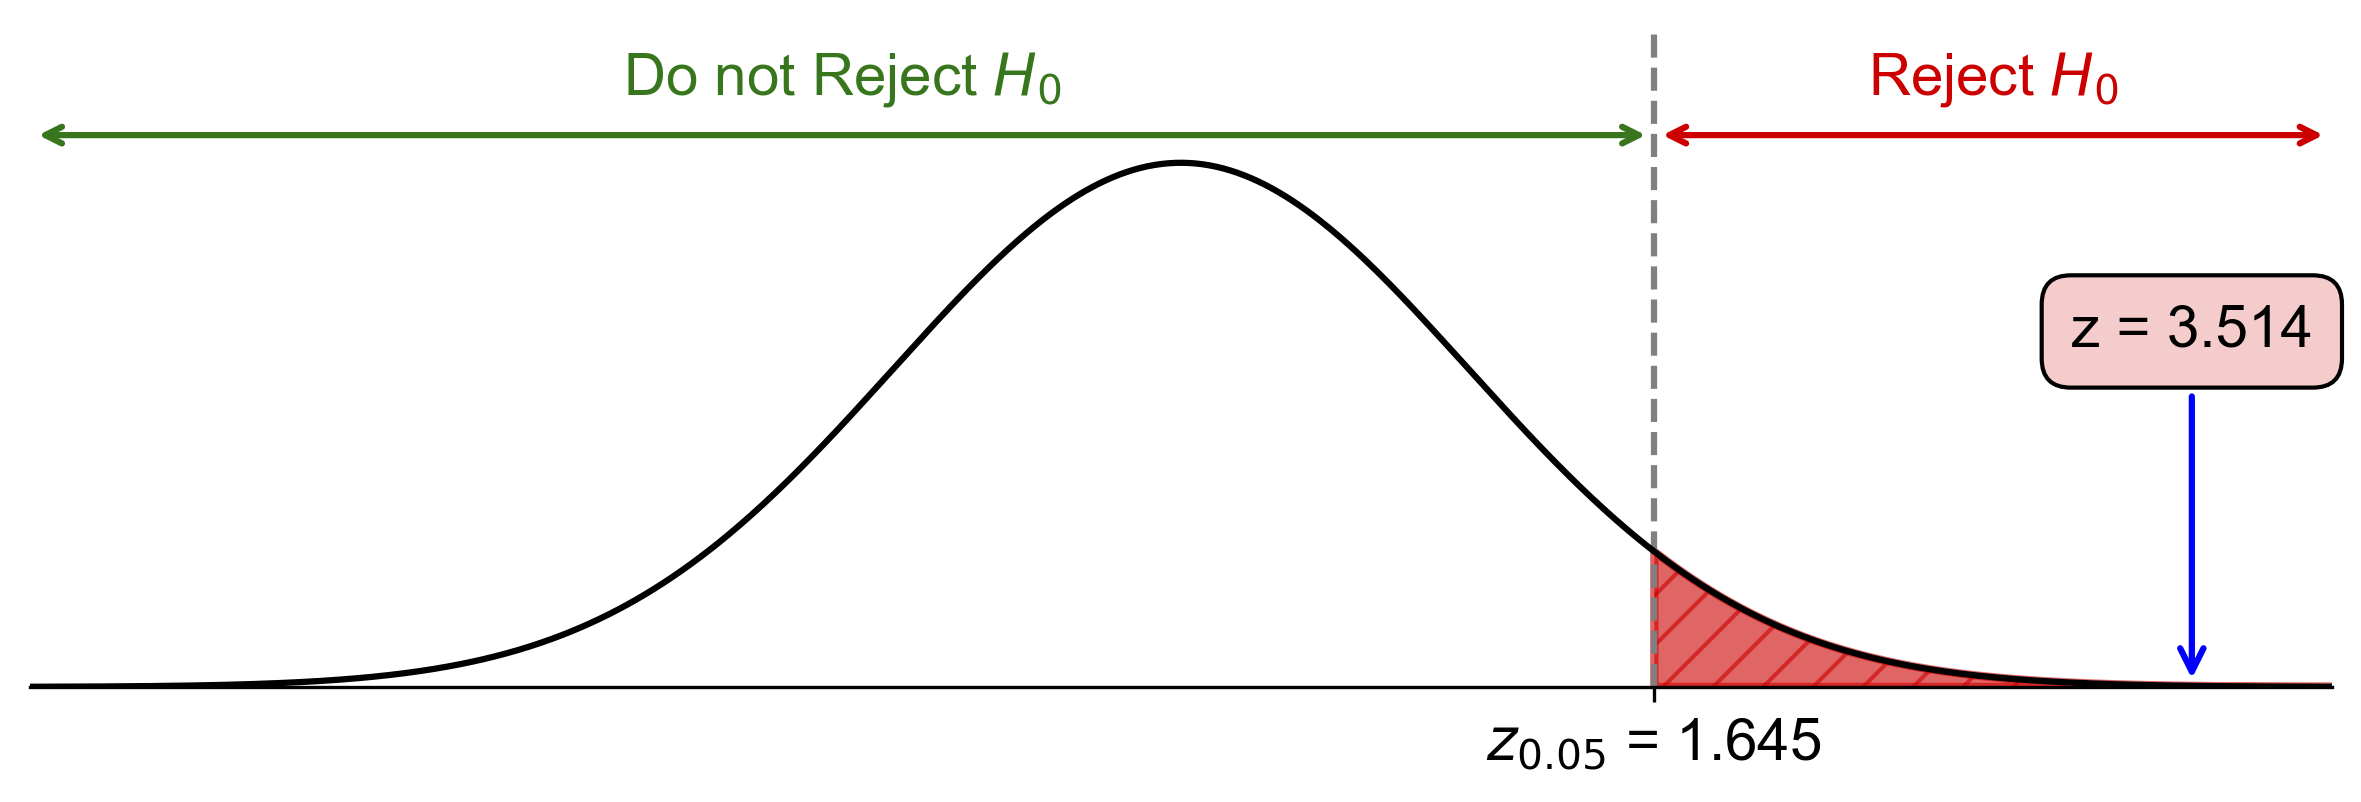
Fig. 7.26 Critical-value approach illustrating the rejection region and test statistic for Example 7.28.#
P-Value Approach:
P-value: \(P(Z > 3.51) \approx 0.0002\)
Since \(0.0002 < \alpha = 0.05\), reject \(H_0\).
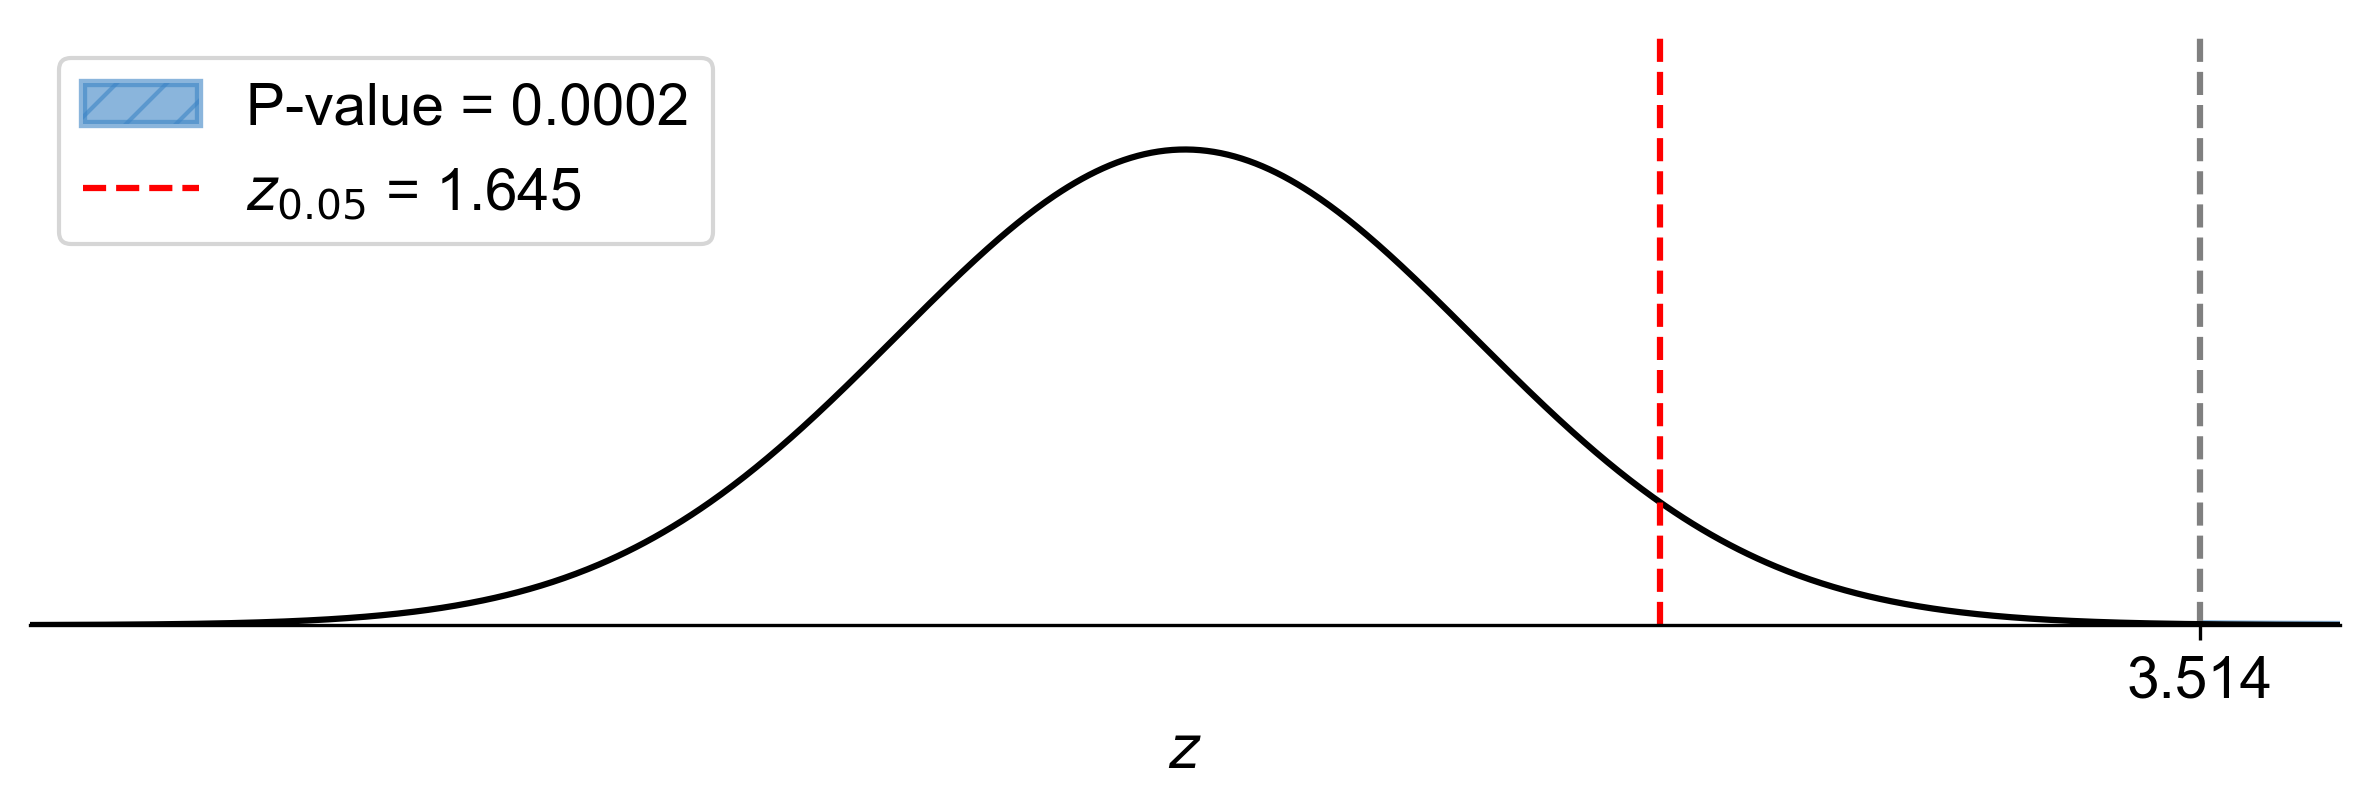
Fig. 7.27 P-value approach showing the significance of the test statistic in relation to the null hypothesis for Example 7.28.#
At the 5% significance level, the data provide sufficient evidence to conclude that the mean weight loss is greater than 5 pounds.
Example 7.29
A pharmaceutical company claims that their new drug reduces blood pressure by more than 10 mmHg on average. To test this claim, a random sample of 25 patients was given the drug, and their reductions in blood pressure (in mmHg) were recorded as follows:
At the 5% significance level, do the data provide sufficient evidence to conclude that the mean reduction in blood pressure is greater than 10 mmHg? Assume that the population standard deviation of blood pressure reductions is 2 mmHg.
Solution:
Hypothesis Test:
Null Hypothesis (\(H_0\)): \(\mu \leq 10\) mmHg
Alternative Hypothesis (\(H_a\)): \(\mu > 10\) mmHg
Sample Statistics:
\(n = 25\)
\(\sigma = 2\) mmHg
\(\overline{x} = 11.16\) mmHg (calculated as the mean of the sample data)
Significance Level: \(\alpha = 0.05\)
Test Statistic:
Critical-Value Approach:
Critical value: \(z_{\alpha} = z_{0.05} = 1.645\)
Since \(2.90 > 1.645\), reject \(H_0\).
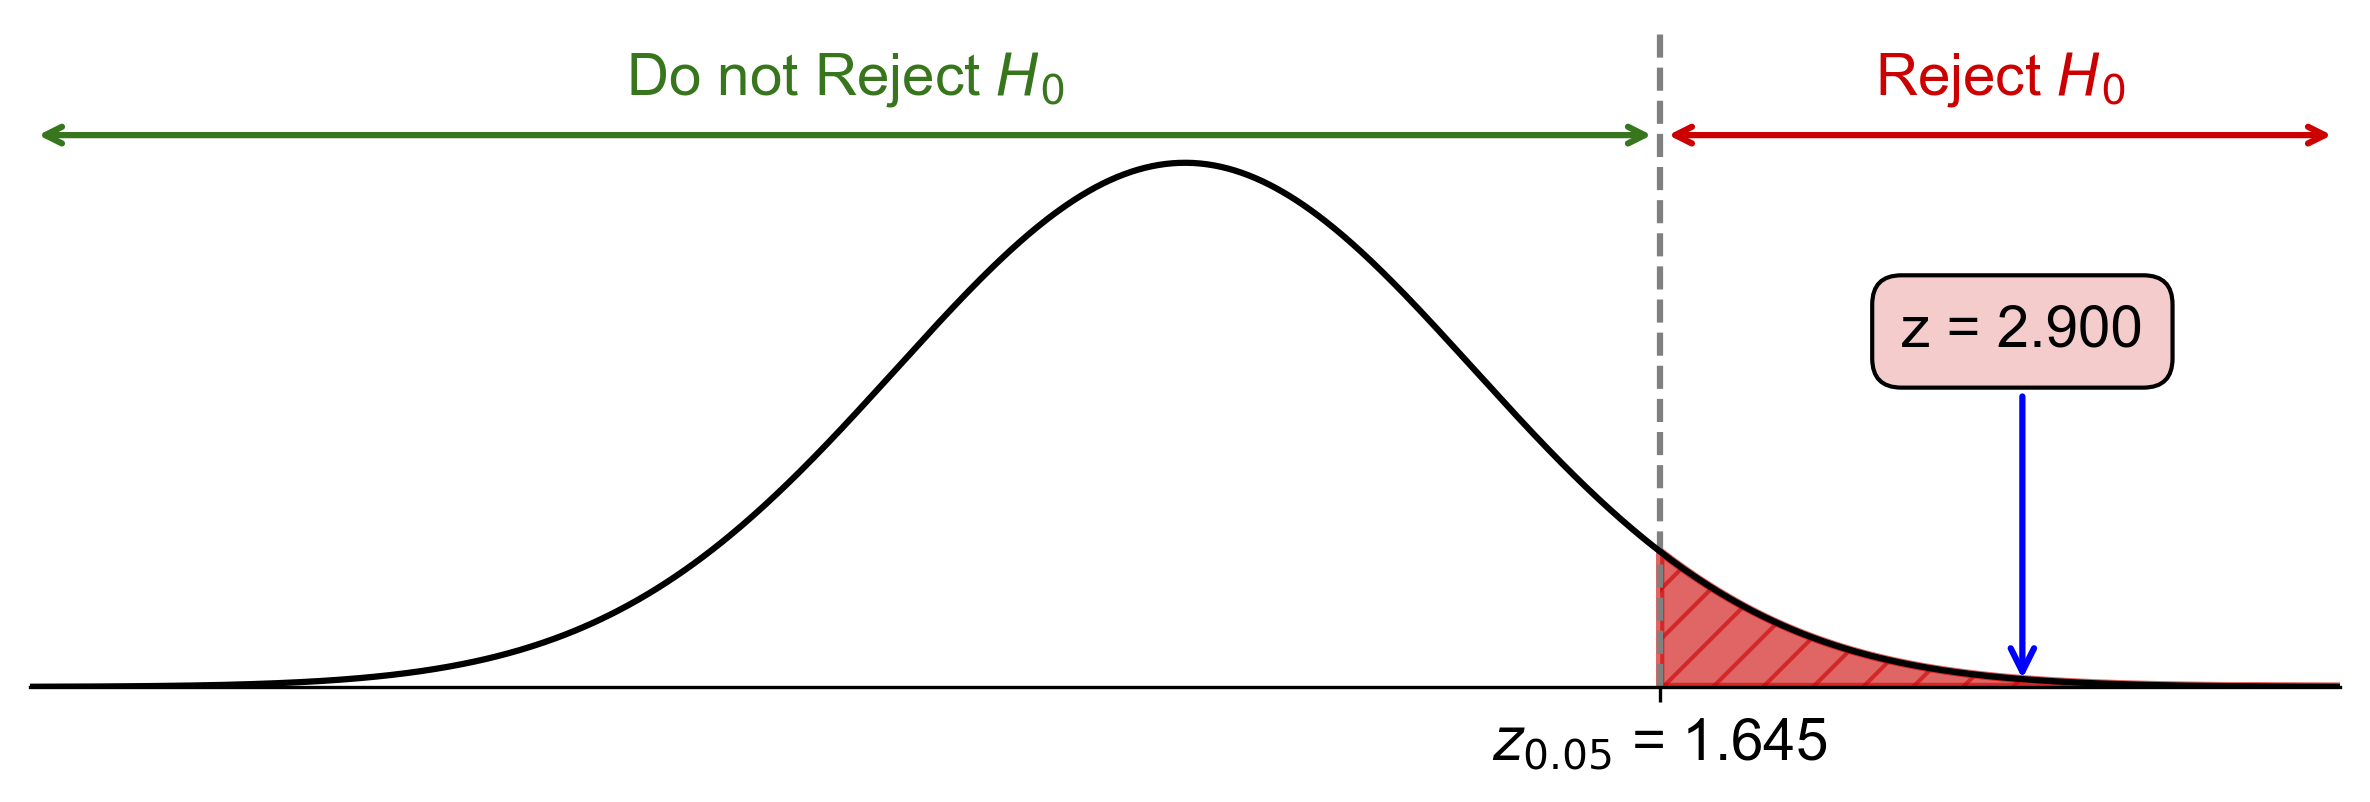
Fig. 7.28 Critical-value approach illustrating the rejection region and test statistic for Example 7.29.#
P-Value Approach:
P-value: \(P(Z > 2.90) \approx 0.0013\)
Since \(0.0013 < \alpha = 0.05\), reject \(H_0\).
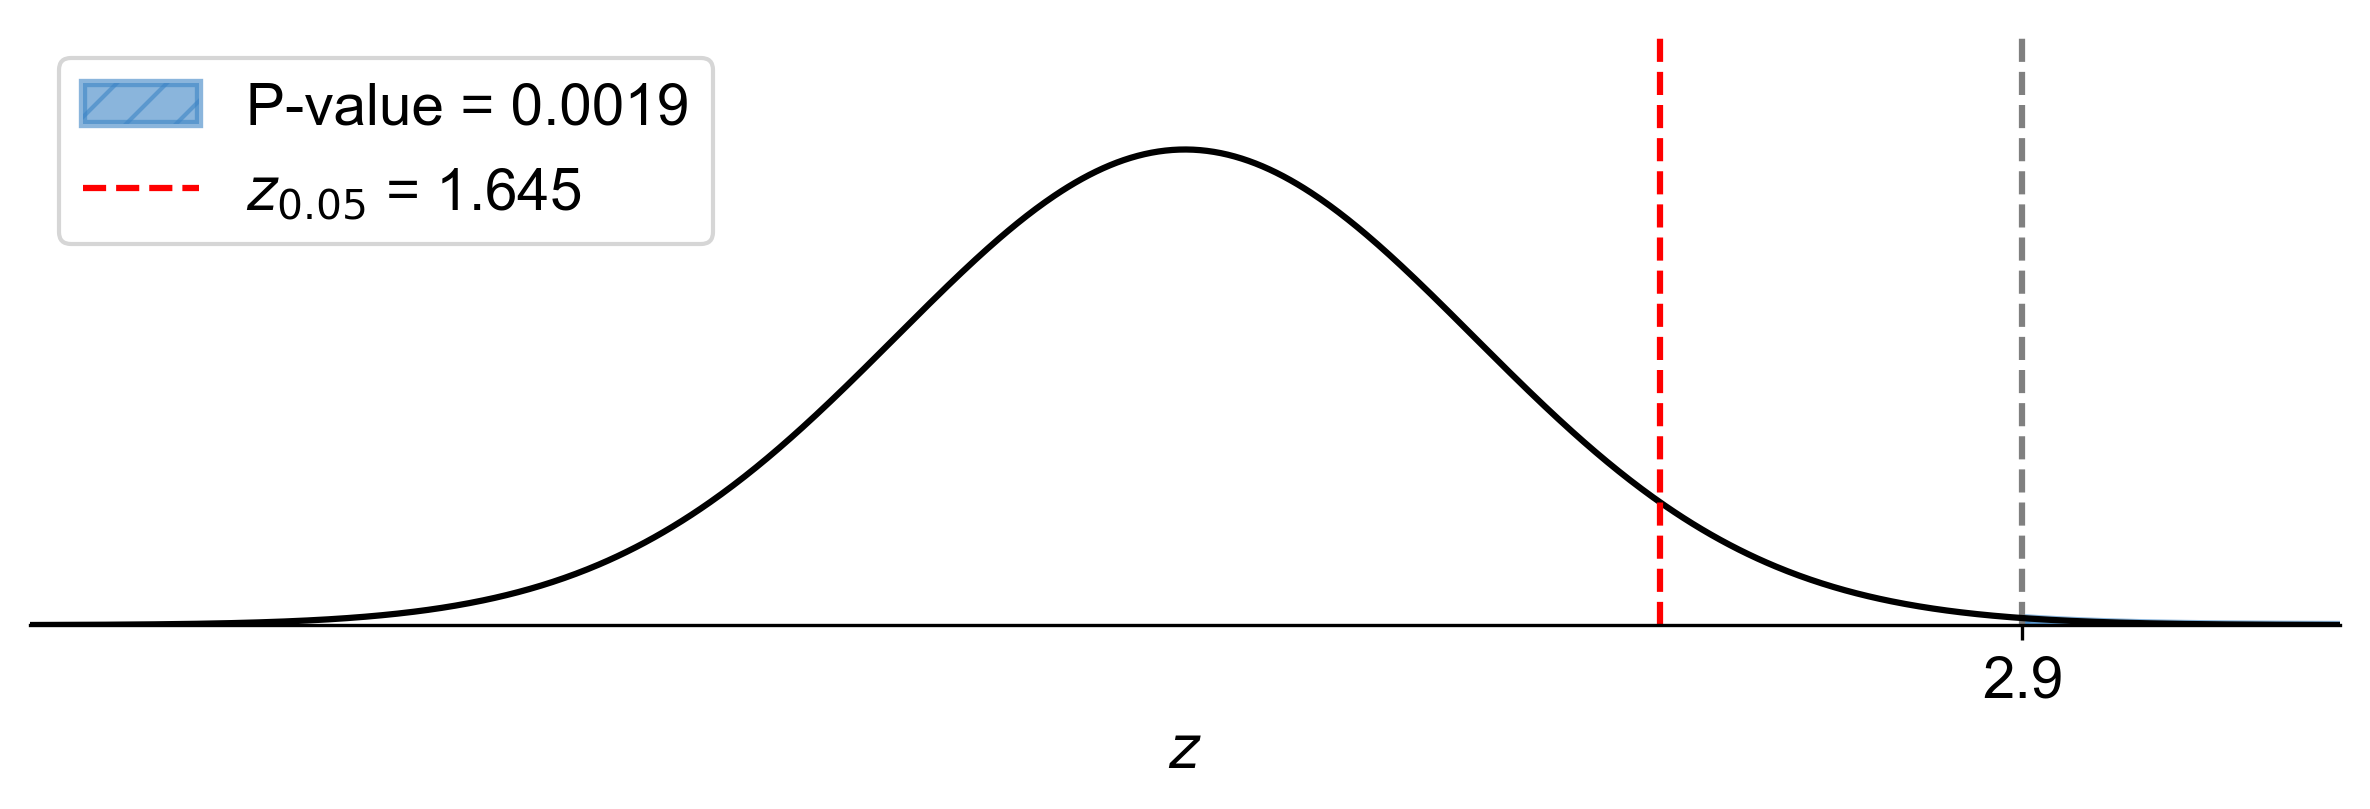
Fig. 7.29 P-value approach demonstrating the significance of the test statistic in relation to the null hypothesis for Example 7.29.#
At the 5% significance level, the data provide sufficient evidence to conclude that the mean reduction in blood pressure is greater than 10 mmHg.
Example 7.30
A fitness trainer claims that a new workout program increases muscle mass by more than 2 kg on average. To test this claim, a random sample of 30 participants followed the workout program for 8 weeks, and their increases in muscle mass (in kg) were recorded as follows:
At the 5% significance level, do the data provide sufficient evidence to conclude that the mean increase in muscle mass is greater than 2 kg? Assume that the population standard deviation of muscle mass increases is 0.5 kg.
Solution:
Hypothesis Test:
Null Hypothesis (\(H_0\)): \(\mu \leq 2\) kg
Alternative Hypothesis (\(H_a\)): \(\mu > 2\) kg
Sample Statistics:
\(n = 30\)
\(\sigma = 0.5\) kg
\(\overline{x} = 2.49\) kg (calculated as the mean of the sample data)
Significance Level: \(\alpha = 0.05\)
Test Statistic:
Critical-Value Approach:
Critical value: \(z_{\alpha} = z_{0.05} = 1.645\)
Since \(5.37 > 1.645\), reject \(H_0\).
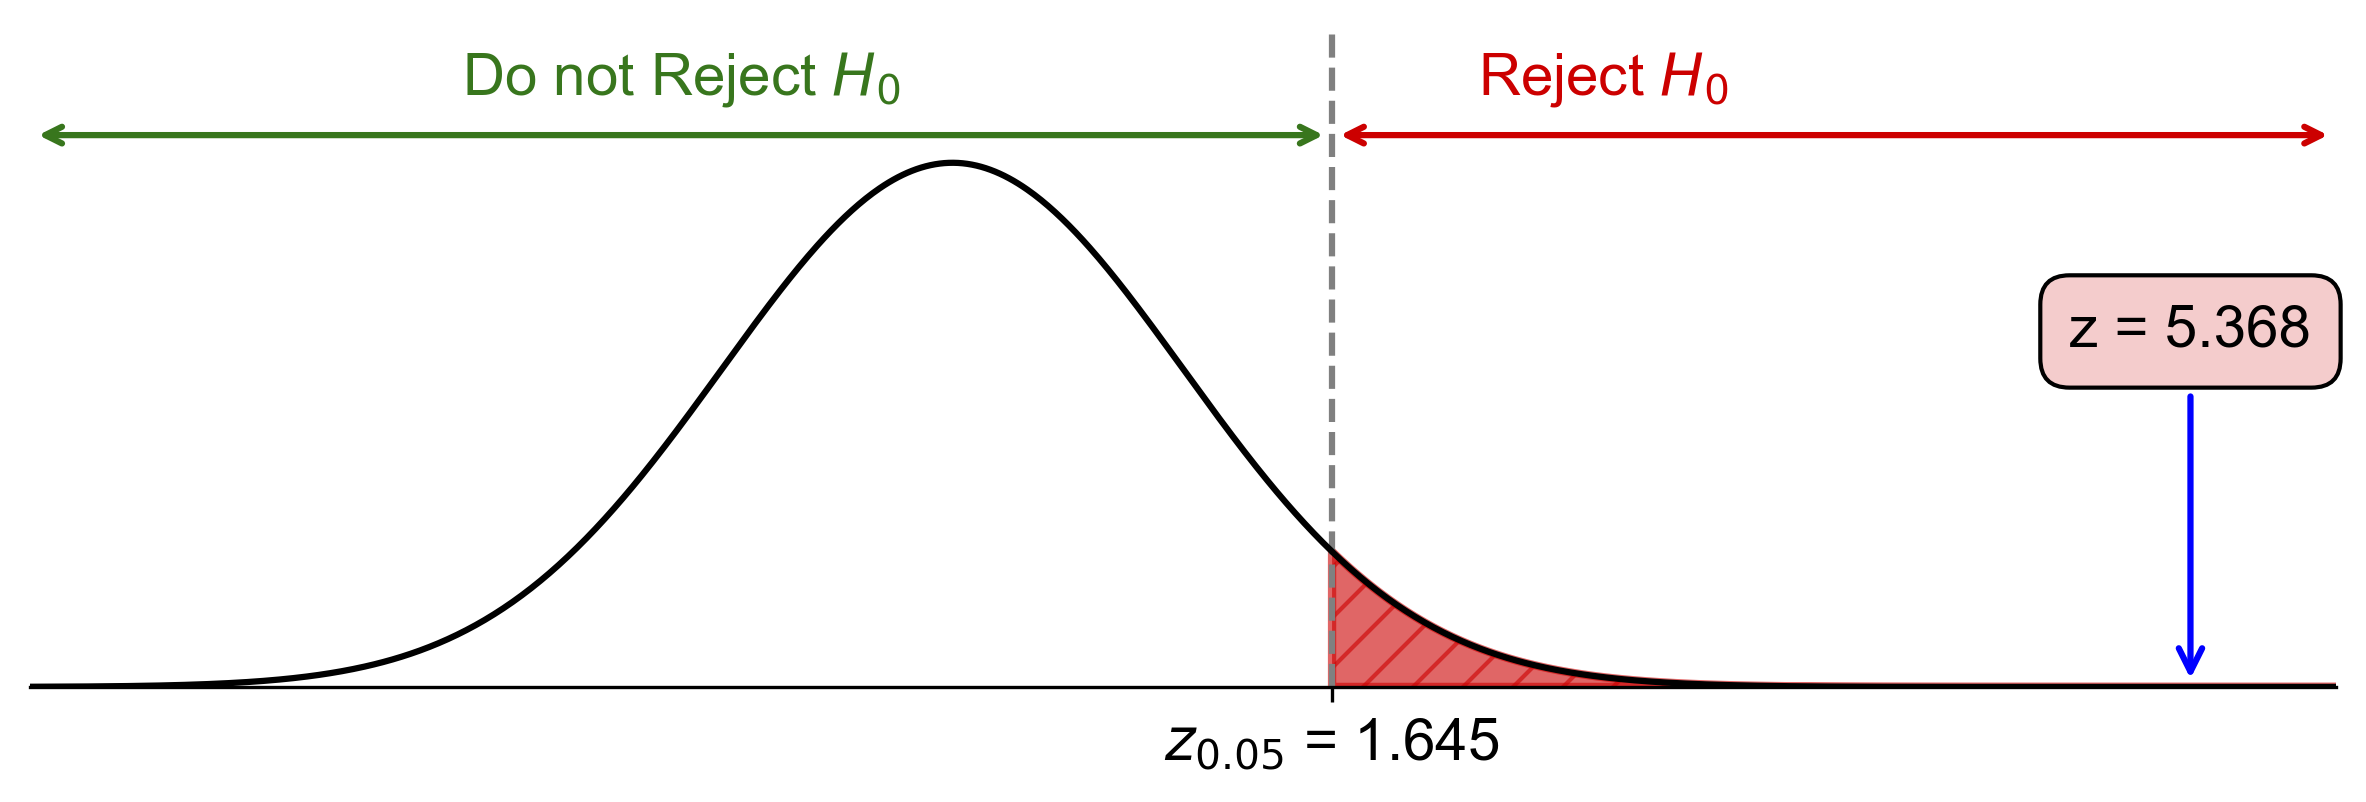
Fig. 7.30 Critical-value approach illustrating the rejection region and test statistic for Example 7.30.#
P-Value Approach:
P-value: \(P(Z > 5.37) \approx 0.000\)
Since \(0.000 < \alpha = 0.05\), reject \(H_0\).
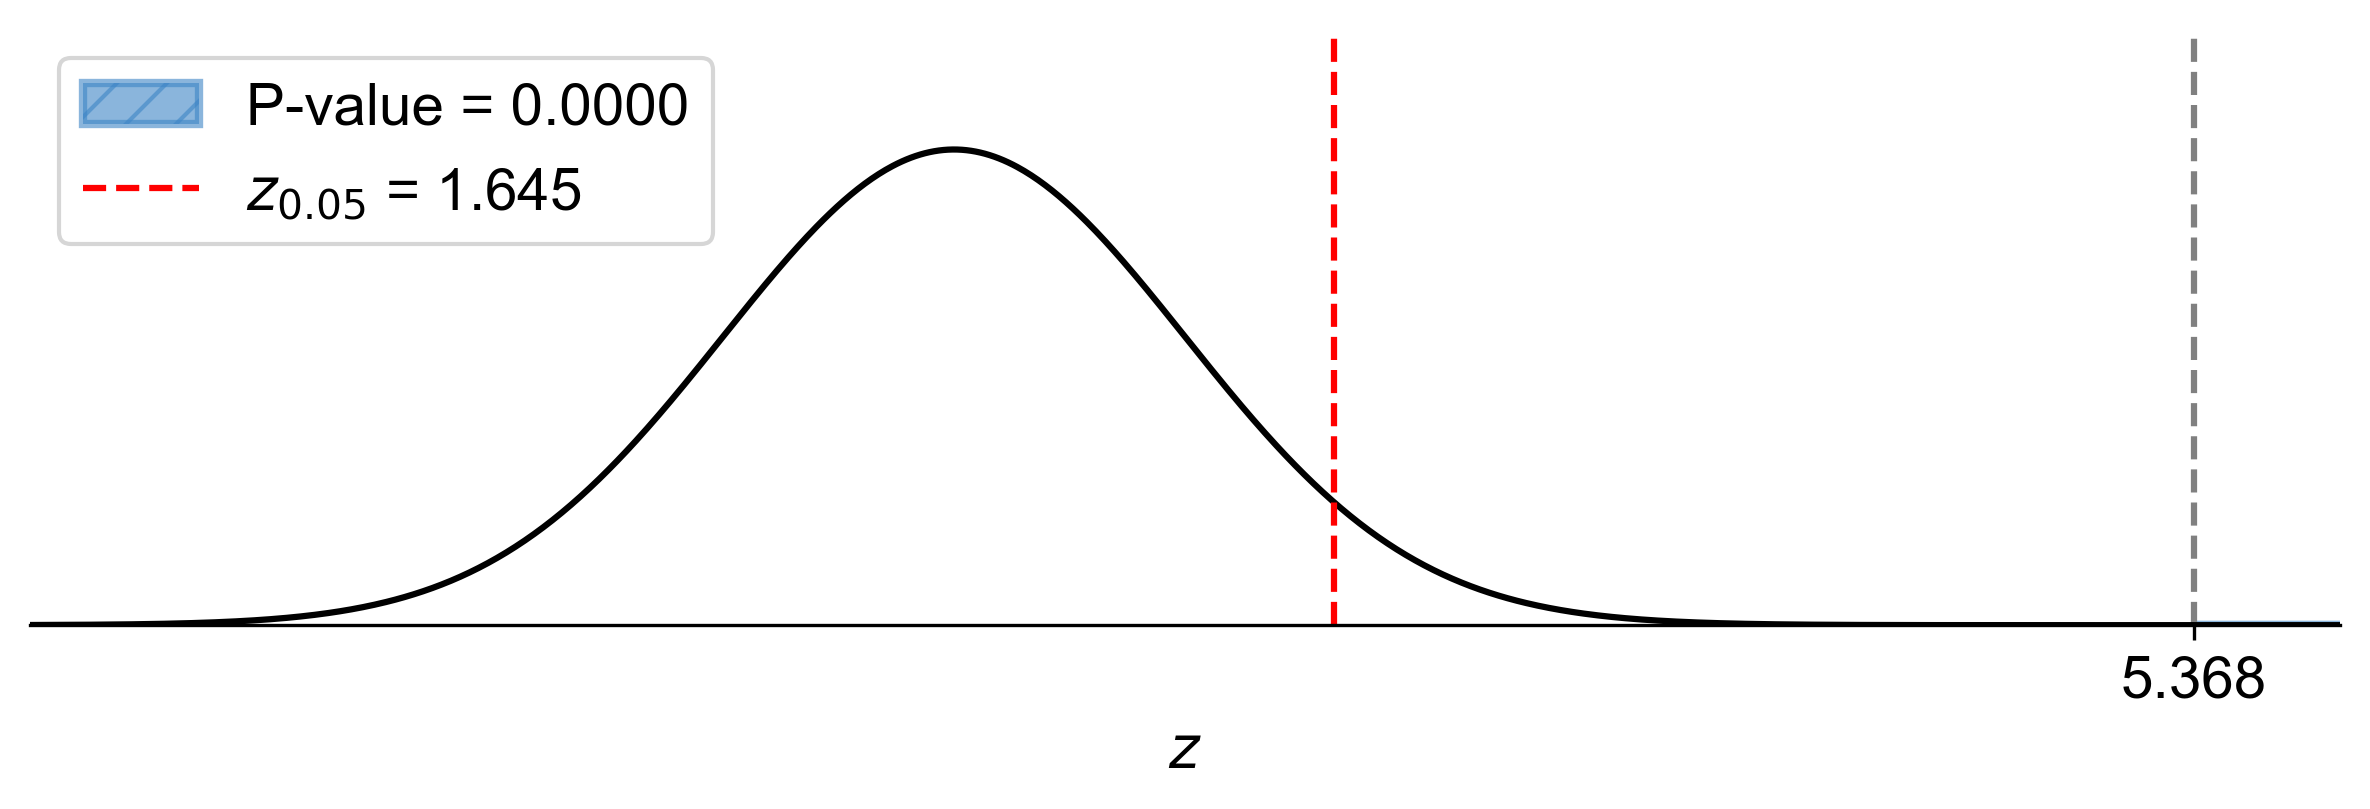
Fig. 7.31 P-value approach demonstrating the significance of the test statistic relative to the null hypothesis for Example 7.30.#
At the 5% significance level, the data provide very strong evidence to conclude that the mean increase in muscle mass is greater than 2 kg.
Example 7.31
A researcher claims that a new teaching method affects students’ test scores. To test this claim, a random sample of 20 students was selected, and their test scores were recorded as follows:
At the 5% significance level, do the data provide sufficient evidence to conclude that the mean test score is different from 80? Assume that the population standard deviation of test scores is 5.
Solution:
Hypothesis Test:
Null Hypothesis (\(H_0\)): \(\mu = 80\)
Alternative Hypothesis (\(H_a\)): \(\mu \neq 80\)
Sample Statistics:
\(n = 20\)
\(\sigma = 5\)
\(\overline{x} = 83.15\) (calculated as the mean of the sample data)
Significance Level: \(\alpha = 0.05\)
Test Statistic:
Critical-Value Approach:
Critical values: \(z_{\alpha/2} = z_{0.025} = \pm 1.96\)
Since \(2.82 > 1.96\), reject \(H_0\).
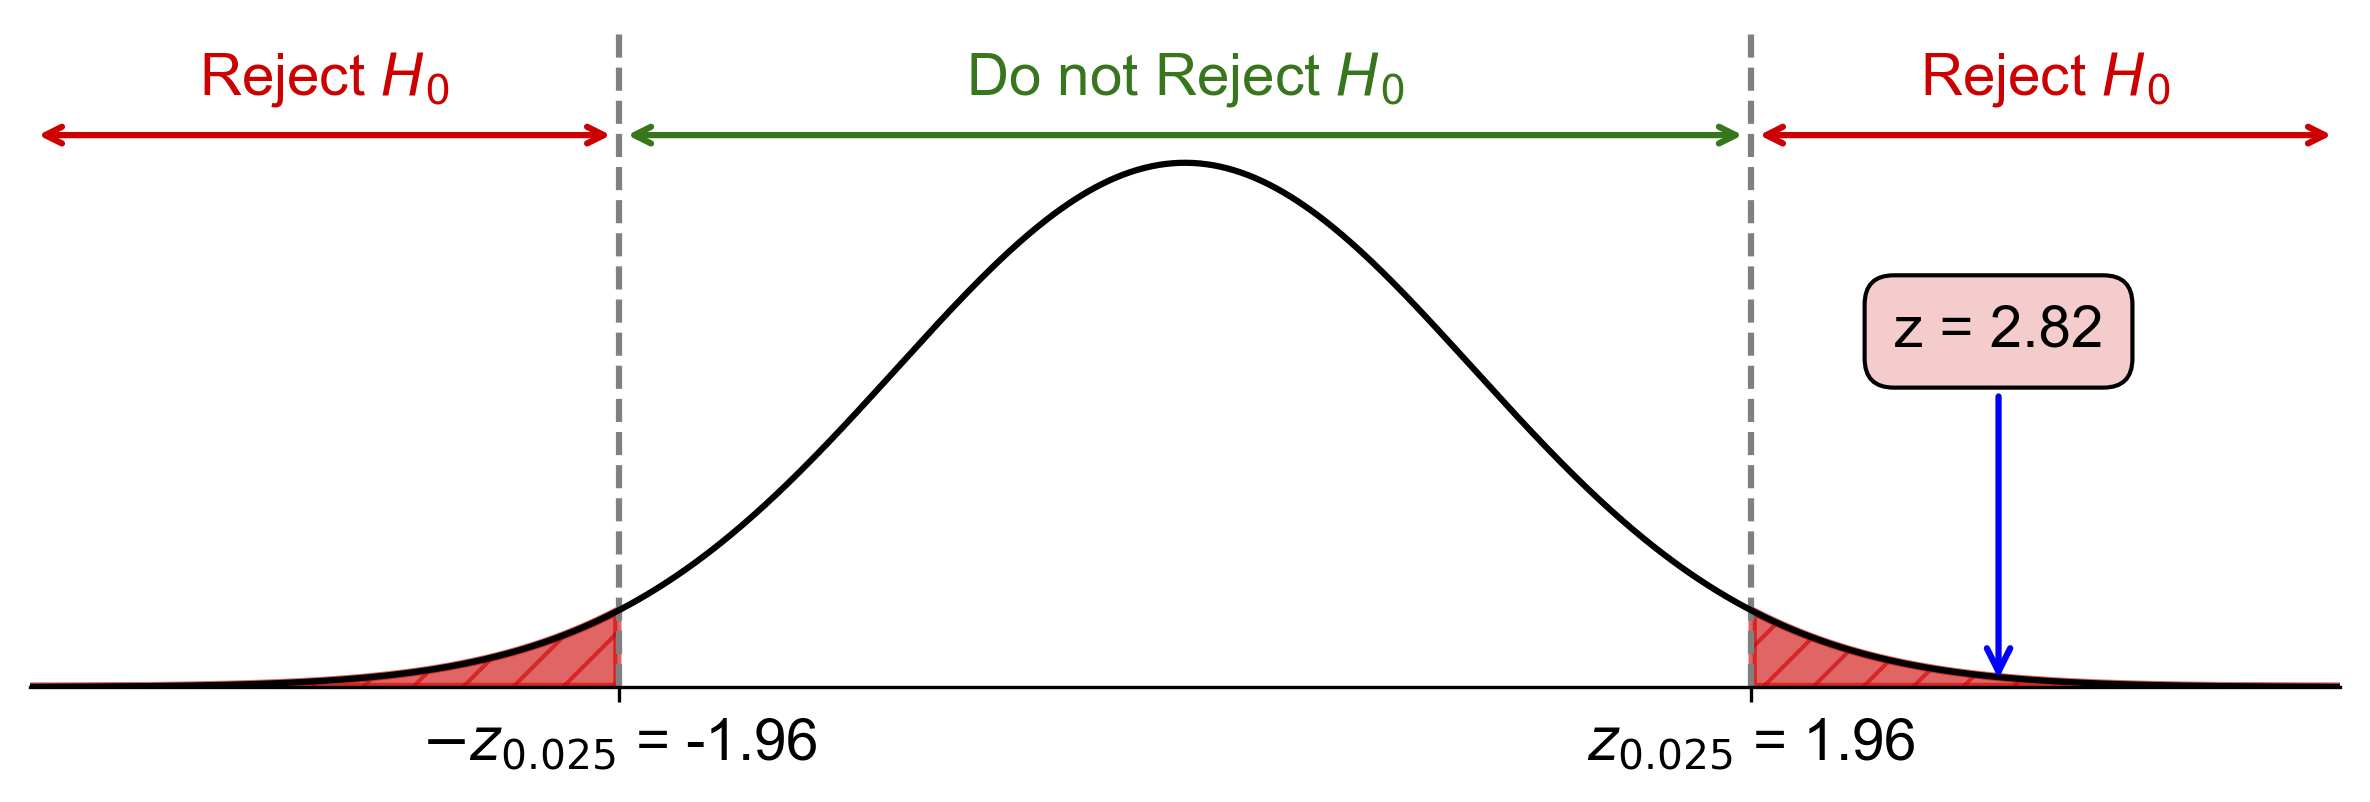
Fig. 7.32 Critical-value approach illustrating the rejection region and test statistic for Example 7.31.#
P-Value Approach:
P-value: \(2 \times P(Z > 2.82) \approx 2 \times 0.0024 = 0.0048\)
Since \(0.0048 < \alpha = 0.05\), reject \(H_0\).
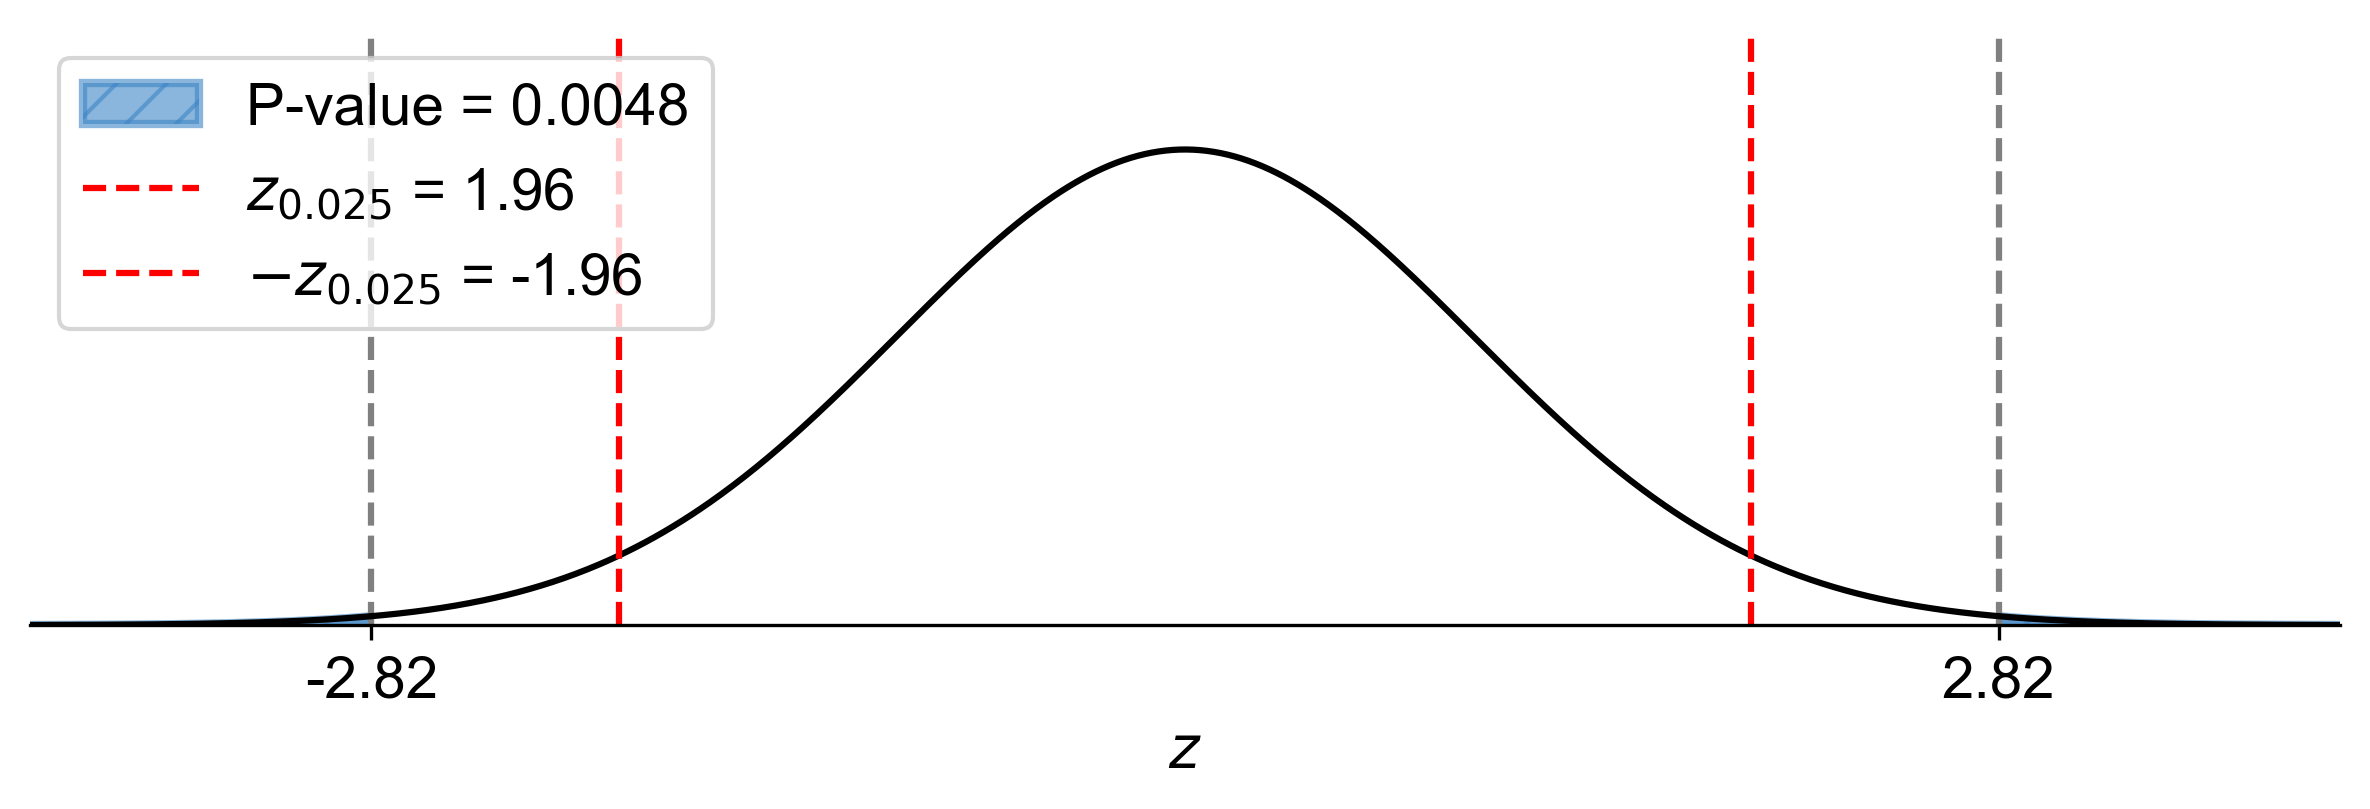
Fig. 7.33 P-value approach demonstrating the significance of the test statistic in relation to the null hypothesis for Example 7.31.#
At the 5% significance level, the data provide sufficient evidence to conclude that the mean test score is different from 80.
Example 7.32
A sports scientist claims that a new training regimen can improve the average sprint time of athletes. To test this claim, a random sample of 15 athletes was selected, and their sprint times (in seconds) were recorded before and after following the training regimen. The differences in sprint times (after - before) are as follows:
At the 5% significance level, do the data provide sufficient evidence to conclude that the mean difference in sprint time is different from 0? Assume that the population standard deviation of sprint time differences is 0.6 seconds.
Solution:
Hypothesis Test:
Null Hypothesis (\(H_0\)): \(\mu = 0\)
Alternative Hypothesis (\(H_a\)): \(\mu \neq 0\)
Sample Statistics:
\(n = 15\)
\(\sigma = 0.6\) seconds
\(\overline{x} = 0.5333\) seconds (calculated as the mean of the sample data)
Significance Level: \(\alpha = 0.05\)
Test Statistic:
Critical-Value Approach:
Critical values: \(z_{\alpha/2} = z_{0.025} = \pm 1.96\)
Since \(3.44 > 1.96\), reject \(H_0\).
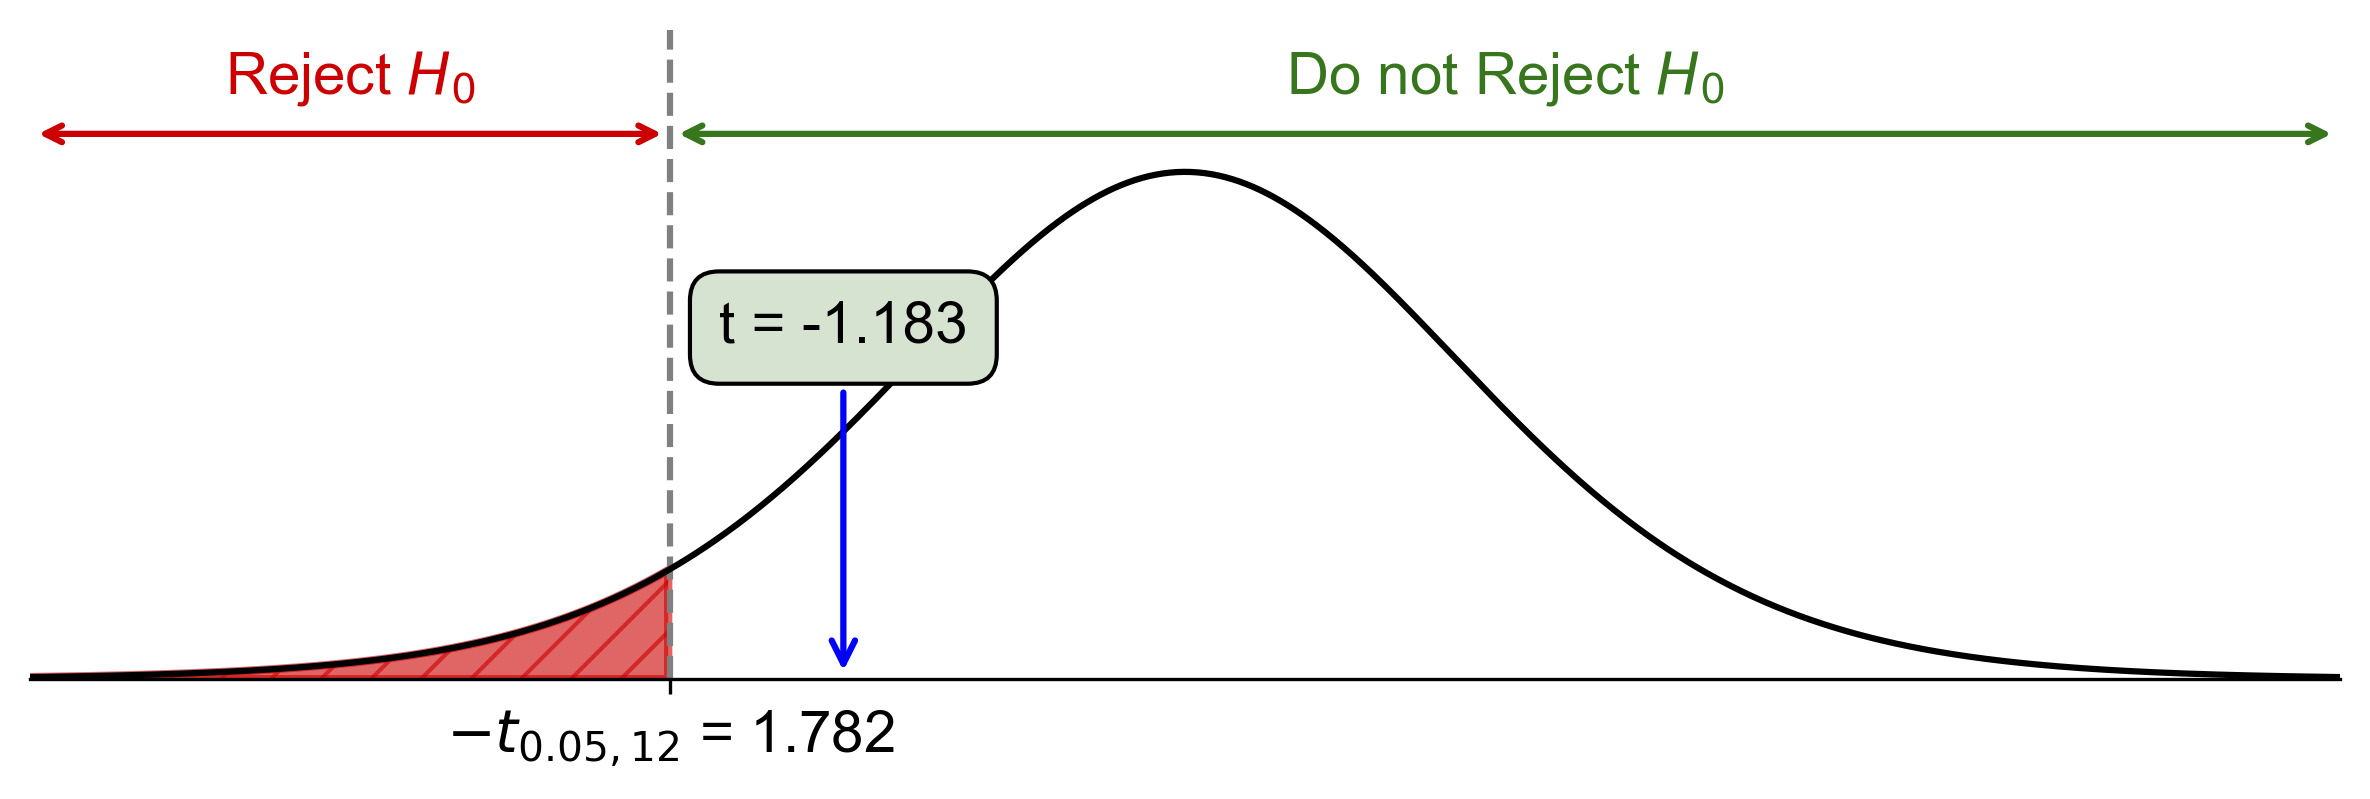
Fig. 7.34 Critical-value approach illustrating the rejection region and test statistic for Example 7.32.#
P-Value Approach:
P-value: \(2 \times P(Z > 3.44) \approx 2 \times 0.0003 = 0.0006\)
Since \(0.0006 < \alpha = 0.05\), reject \(H_0\).
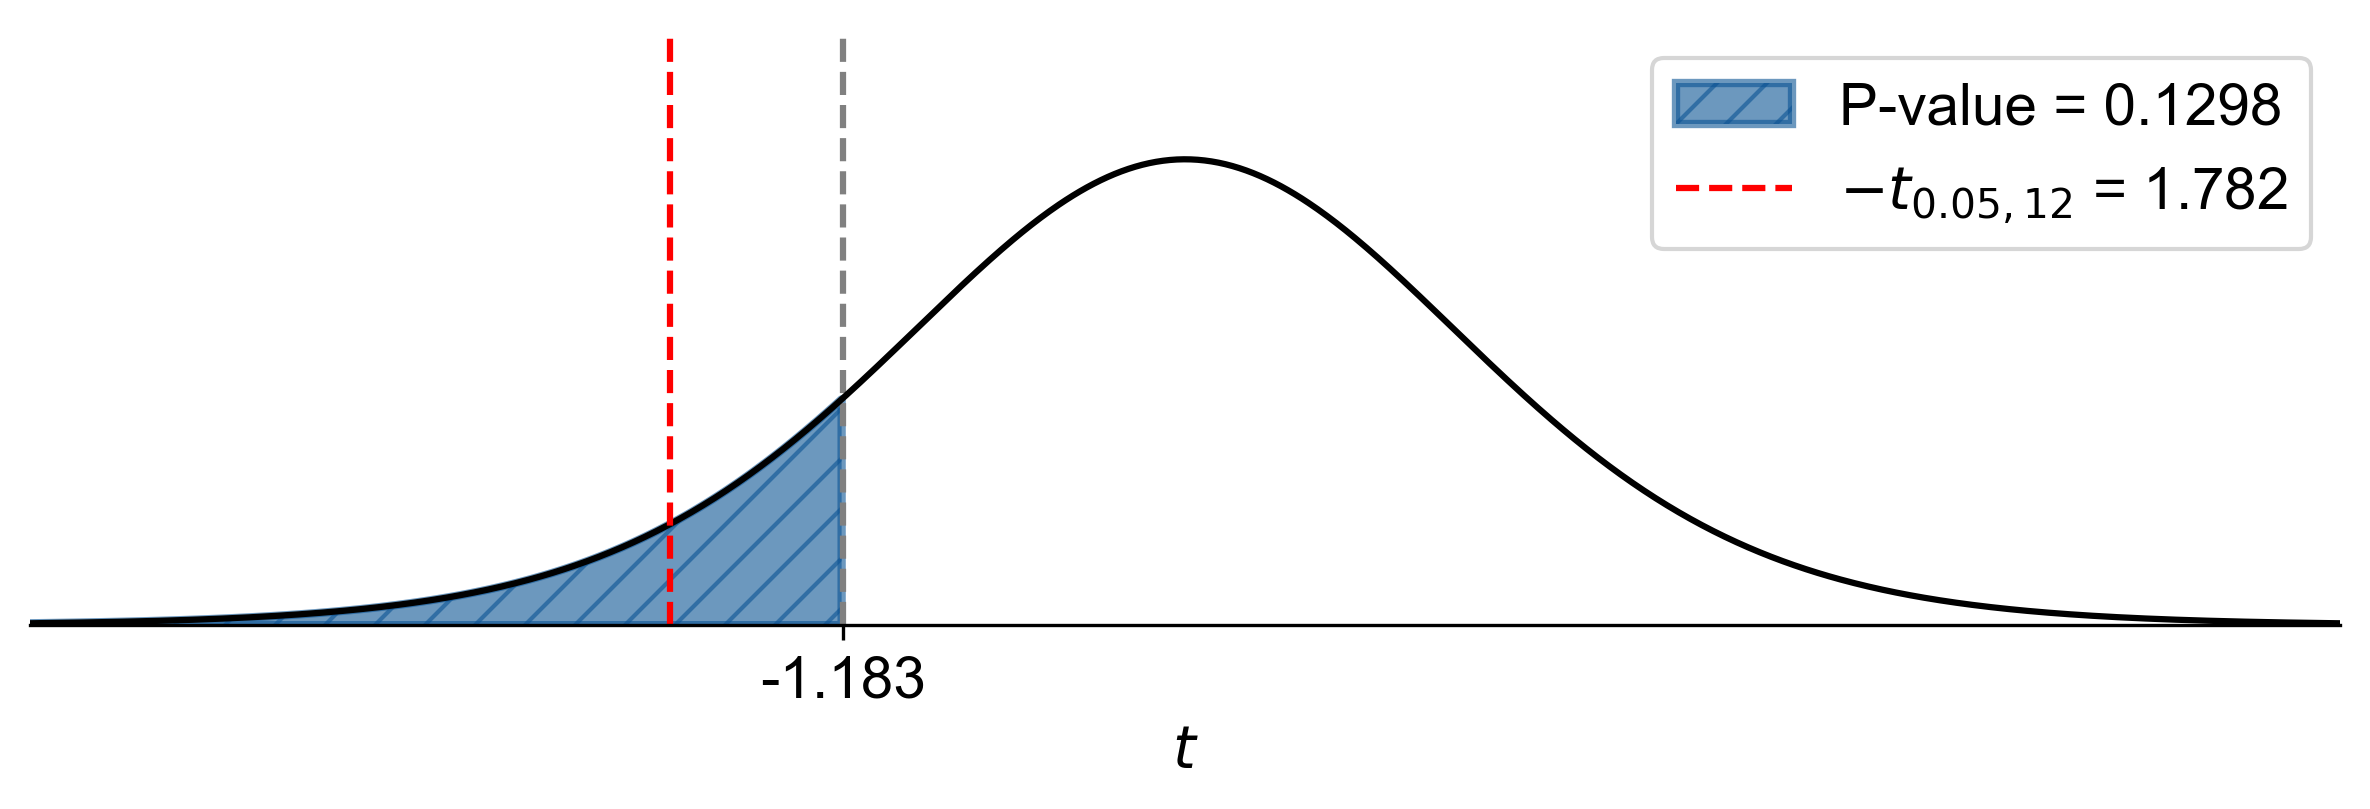
Fig. 7.35 P-value approach demonstrating the significance of the test statistic in relation to the null hypothesis for Example 7.32.#
At the 5% significance level, the data provide strong evidence to conclude that the mean difference in sprint time is different from 0.
