1.3. Sampling#
Definition - Sampling
In statistics, sampling is a process of selecting a part of a population to collect and analyze data. The goal of sampling is to draw conclusions about the population based on the sample data. To make sure that the sample reflects the population, we need to use random sampling techniques that reduce bias and increase variation. Random sampling techniques include simple random sampling, stratified sampling, cluster sampling, and systematic sampling [Cochran, 1977, Lohr, 2022].
1.3.1. Simple Random Sampling#
In statistics, simple random sampling is a fundamental sampling technique where each member of a population has an equal chance of being included in the sample [Cochran, 1977, Lohr, 2022]. Here’s how it works:
Assign a Unique Number: Every individual in the population is assigned a unique numerical identifier.
Random Selection: A random number generator is used to select a subset of these identifiers without bias.
Form the Sample: The individuals corresponding to the selected numbers constitute the sample.
This approach ensures that every possible sample has an equal probability of selection, making the sample representative of the entire population. It’s a fair and unbiased method that supports the validity of statistical analysis.
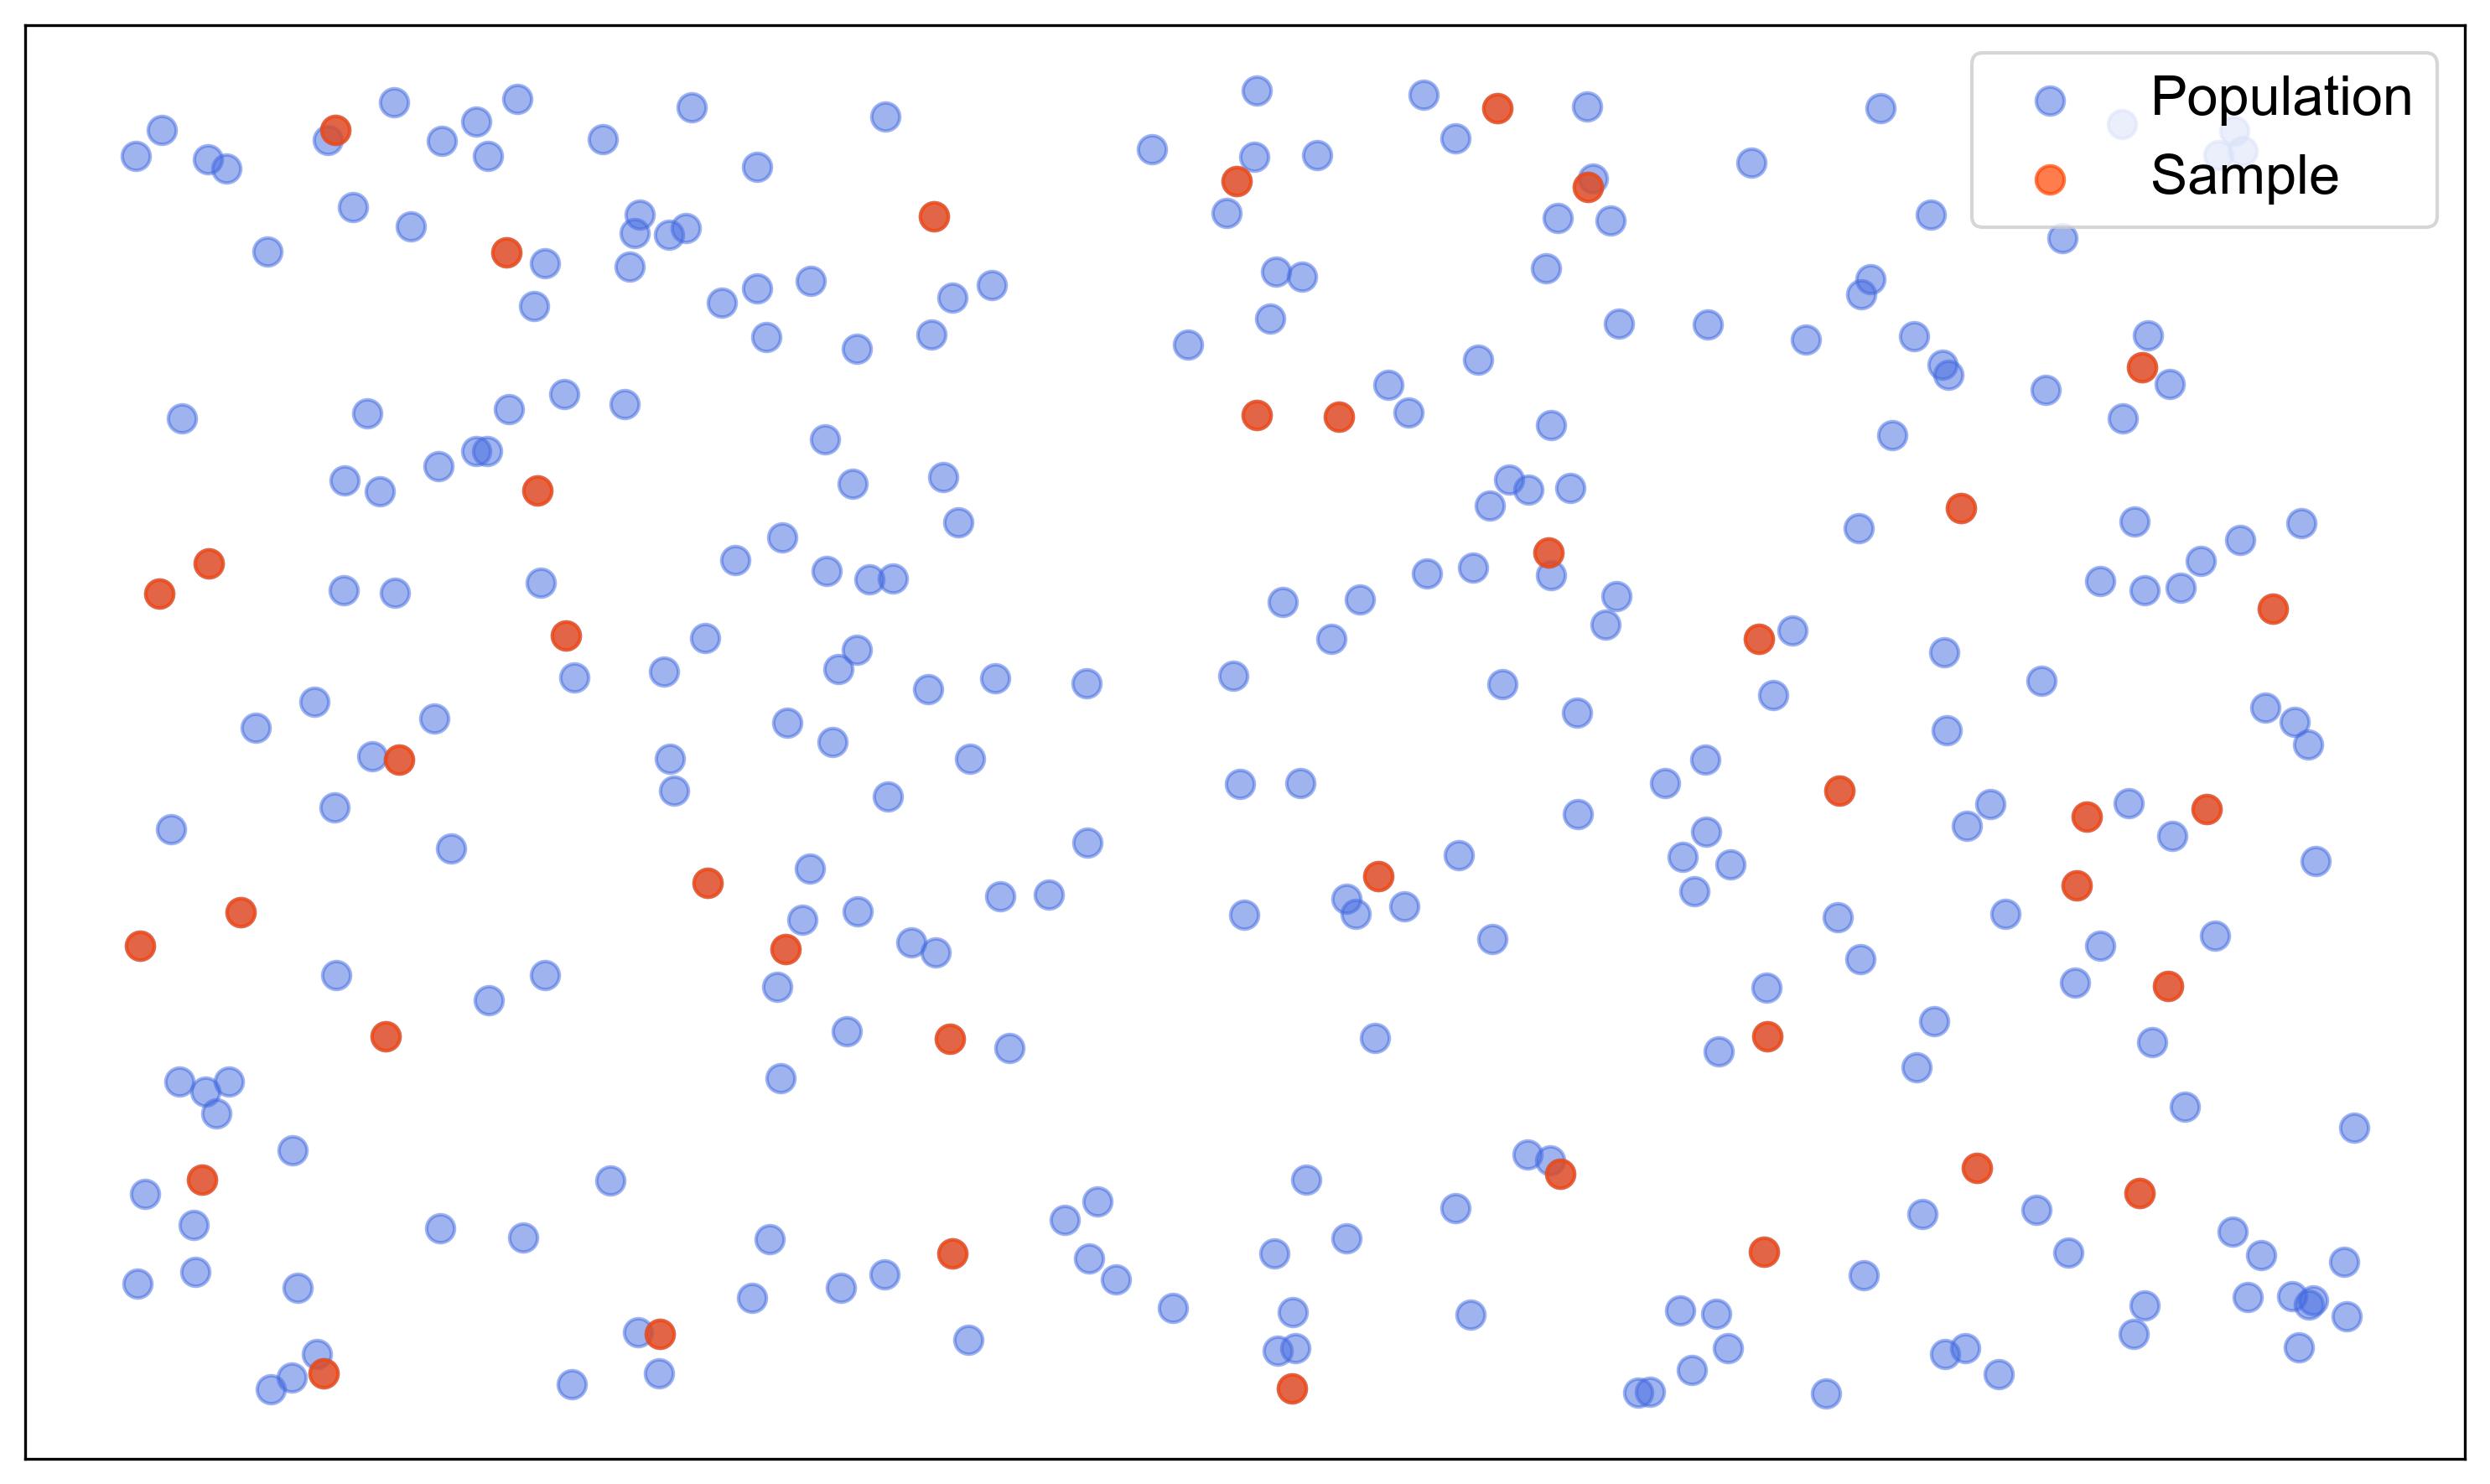
Fig. 1.3 illustrates a simple random sampling method where a subset of points is randomly selected from a larger population. The plot contains 300 points in total, with 40 points highlighted in red to represent the sample, while the remaining points are in blue, representing the population.

Fig. 1.3 Simple Random Sampling Visualization: A subset of points selected from a larger population.#
Key features of the figure:
Population Points: Blue points represent the entire population from which the sample is drawn.
Sample Points: Red points represent the randomly selected sample from the population.
Random Selection: The sample points are chosen randomly, ensuring that each point in the population has an equal chance of being selected.
Example 1.10
Let’s say we have a population of 50 students in a class and we want to select a sample of 5 students using simple random sampling. Here’s how we might do it:
Assign Numbers: Each student is given a unique number from 1 to 50.
Use a Random Number Generator: We use a random number generator to pick 5 unique numbers between 1 and 50.
Select Students: The students with the numbers that match the generated numbers are included in the sample.
For example, if the random number generator picks the numbers 4, 15, 29, 42, and 50, then the students assigned those numbers would be the ones selected for the sample.
This sample would then be used to represent the entire class for whatever statistical analysis we aim to perform. The key is that every student had an equal chance of being selected, ensuring the sample’s representativeness.
1.3.2. Stratified Sampling#
In statistics, stratified sampling is a technique used to create a sample that’s representative of the entire population [Cochran, 1977, Lohr, 2022]. It’s done by following these steps:
Identify the Population: Determine who or what you’re studying and what characteristic (variable) you’re interested in.
Create Strata: Divide the population into subgroups (strata) based on shared characteristics like age, occupation, income, etc.
Classify Members: Place each member of the population into one, and only one, of these strata.
Determine Sample Sizes: Use a statistical formula or table to decide how many members to sample from each stratum.
Random Sampling: Within each stratum, use a random method, like a random number generator, to select members for the sample.
Combine Samples: Bring together the randomly selected members from each stratum to form your complete stratified sample.
This method ensures that each subgroup is proportionately represented in the sample, reducing bias and increasing the accuracy of your results. It’s particularly useful when there are distinct, separate layers within a population that you want to ensure are included in your analysis.
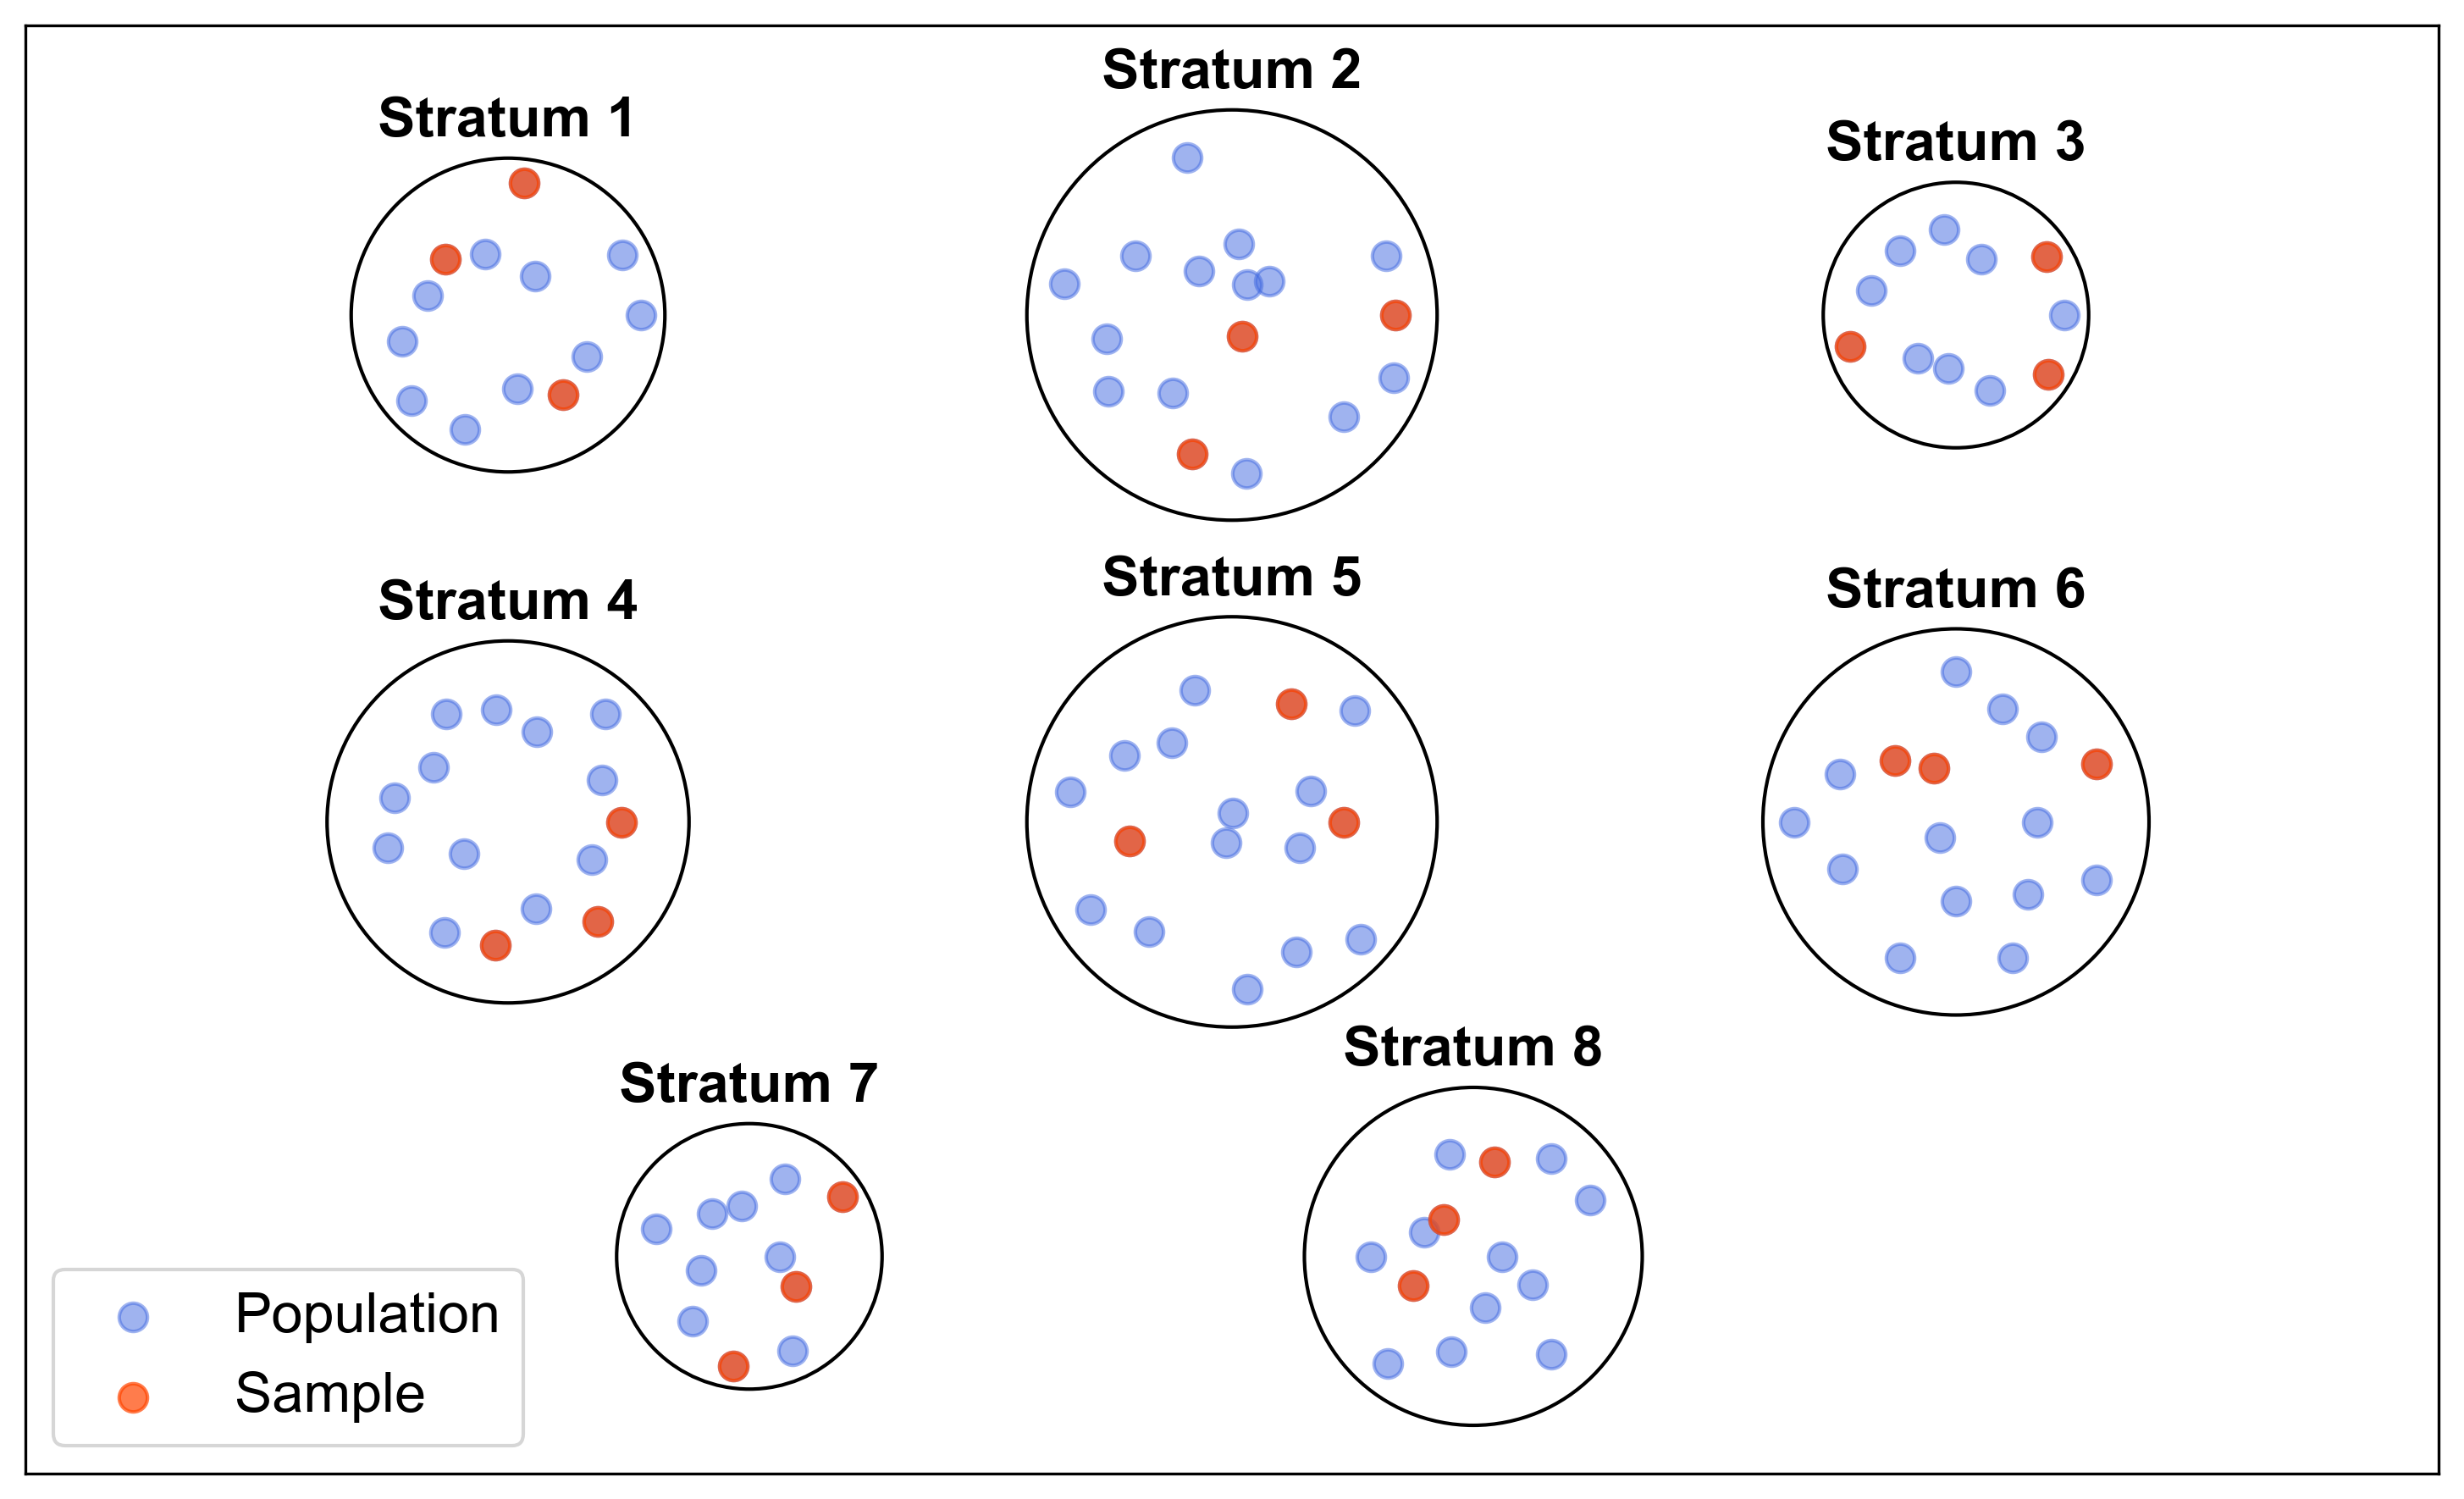
Fig. 1.4 illustrates a stratified sampling method where the population is divided into distinct strata. Each stratum is represented by a circle, and within each circle, there are a varying number of points (between 8 and 20). Out of these, 3 points are highlighted in red to represent the sample, while the remaining points are in blue, representing the population.

Fig. 1.4 Stratified Sampling Visualization: Each stratum contains a mix of population and sample points.#
Key features of the figure:
Stratum Centers: The centers of the strata are strategically placed to ensure clear separation.
Population Points: Blue points within each stratum represent the population.
Sample Points: Red points within each stratum represent the randomly selected sample.
Circles: Each stratum is enclosed in a circle to visually separate it from others.
Example 1.11
Let’s consider an example of stratified sampling using a population of students in a university:
Imagine we have a university with 10,000 students and we want to conduct a survey about their study habits. We decide to use stratified sampling to ensure that our sample accurately reflects the different faculties within the university. Here’s how we might proceed:
Identify the Population: Our population is the 10,000 students at the university.
Create Strata: We divide the population into strata based on the faculties, such as Arts, Sciences, Business, and Engineering.
Classify Members: We classify each student into their respective faculty.
Determine Sample Sizes: Suppose we decide to sample 5% of each faculty. If there are 2,000 Arts students, 3,000 Sciences students, 3,000 Business students, and 2,000 Engineering students, our sample sizes would be 100, 150, 150, and 100 respectively.
2,000 students
3,000 students
3,000 students
2,000 students
Random Sampling: We randomly select 100 Arts students, 150 Sciences students, 150 Business students, and 100 Engineering students using a random number generator.
Randomly selected 100 students
Randomly selected 150 students
Randomly selected 150 students
Randomly selected 100 students
Combine Samples: We combine these students to form our stratified sample of 500 students, which proportionately represents each faculty.
This stratified sample can now be used to gather data on study habits, with the assurance that each faculty is adequately represented, thus providing a more accurate reflection of the entire student body.
1.3.3. Cluster Sampling#
Cluster sampling is a statistical method used when a population is too large or widespread to conduct simple random sampling [Thompson, 2012]. It involves these steps:
Divide into Clusters: The population is divided into non-overlapping groups, known as clusters, which are often based on geographical areas or other natural divisions.
Randomly Select Clusters: A random sample of these clusters is chosen, not individual members.
Survey Entire Clusters: Every member within the selected clusters is included in the sample.
This method is practical for large, dispersed populations, but it’s important to ensure the clusters are diverse and representative to minimize bias and increase the reliability of the results. Unlike simple random sampling, cluster sampling can introduce more variability, so the selection and composition of clusters are crucial for accuracy.
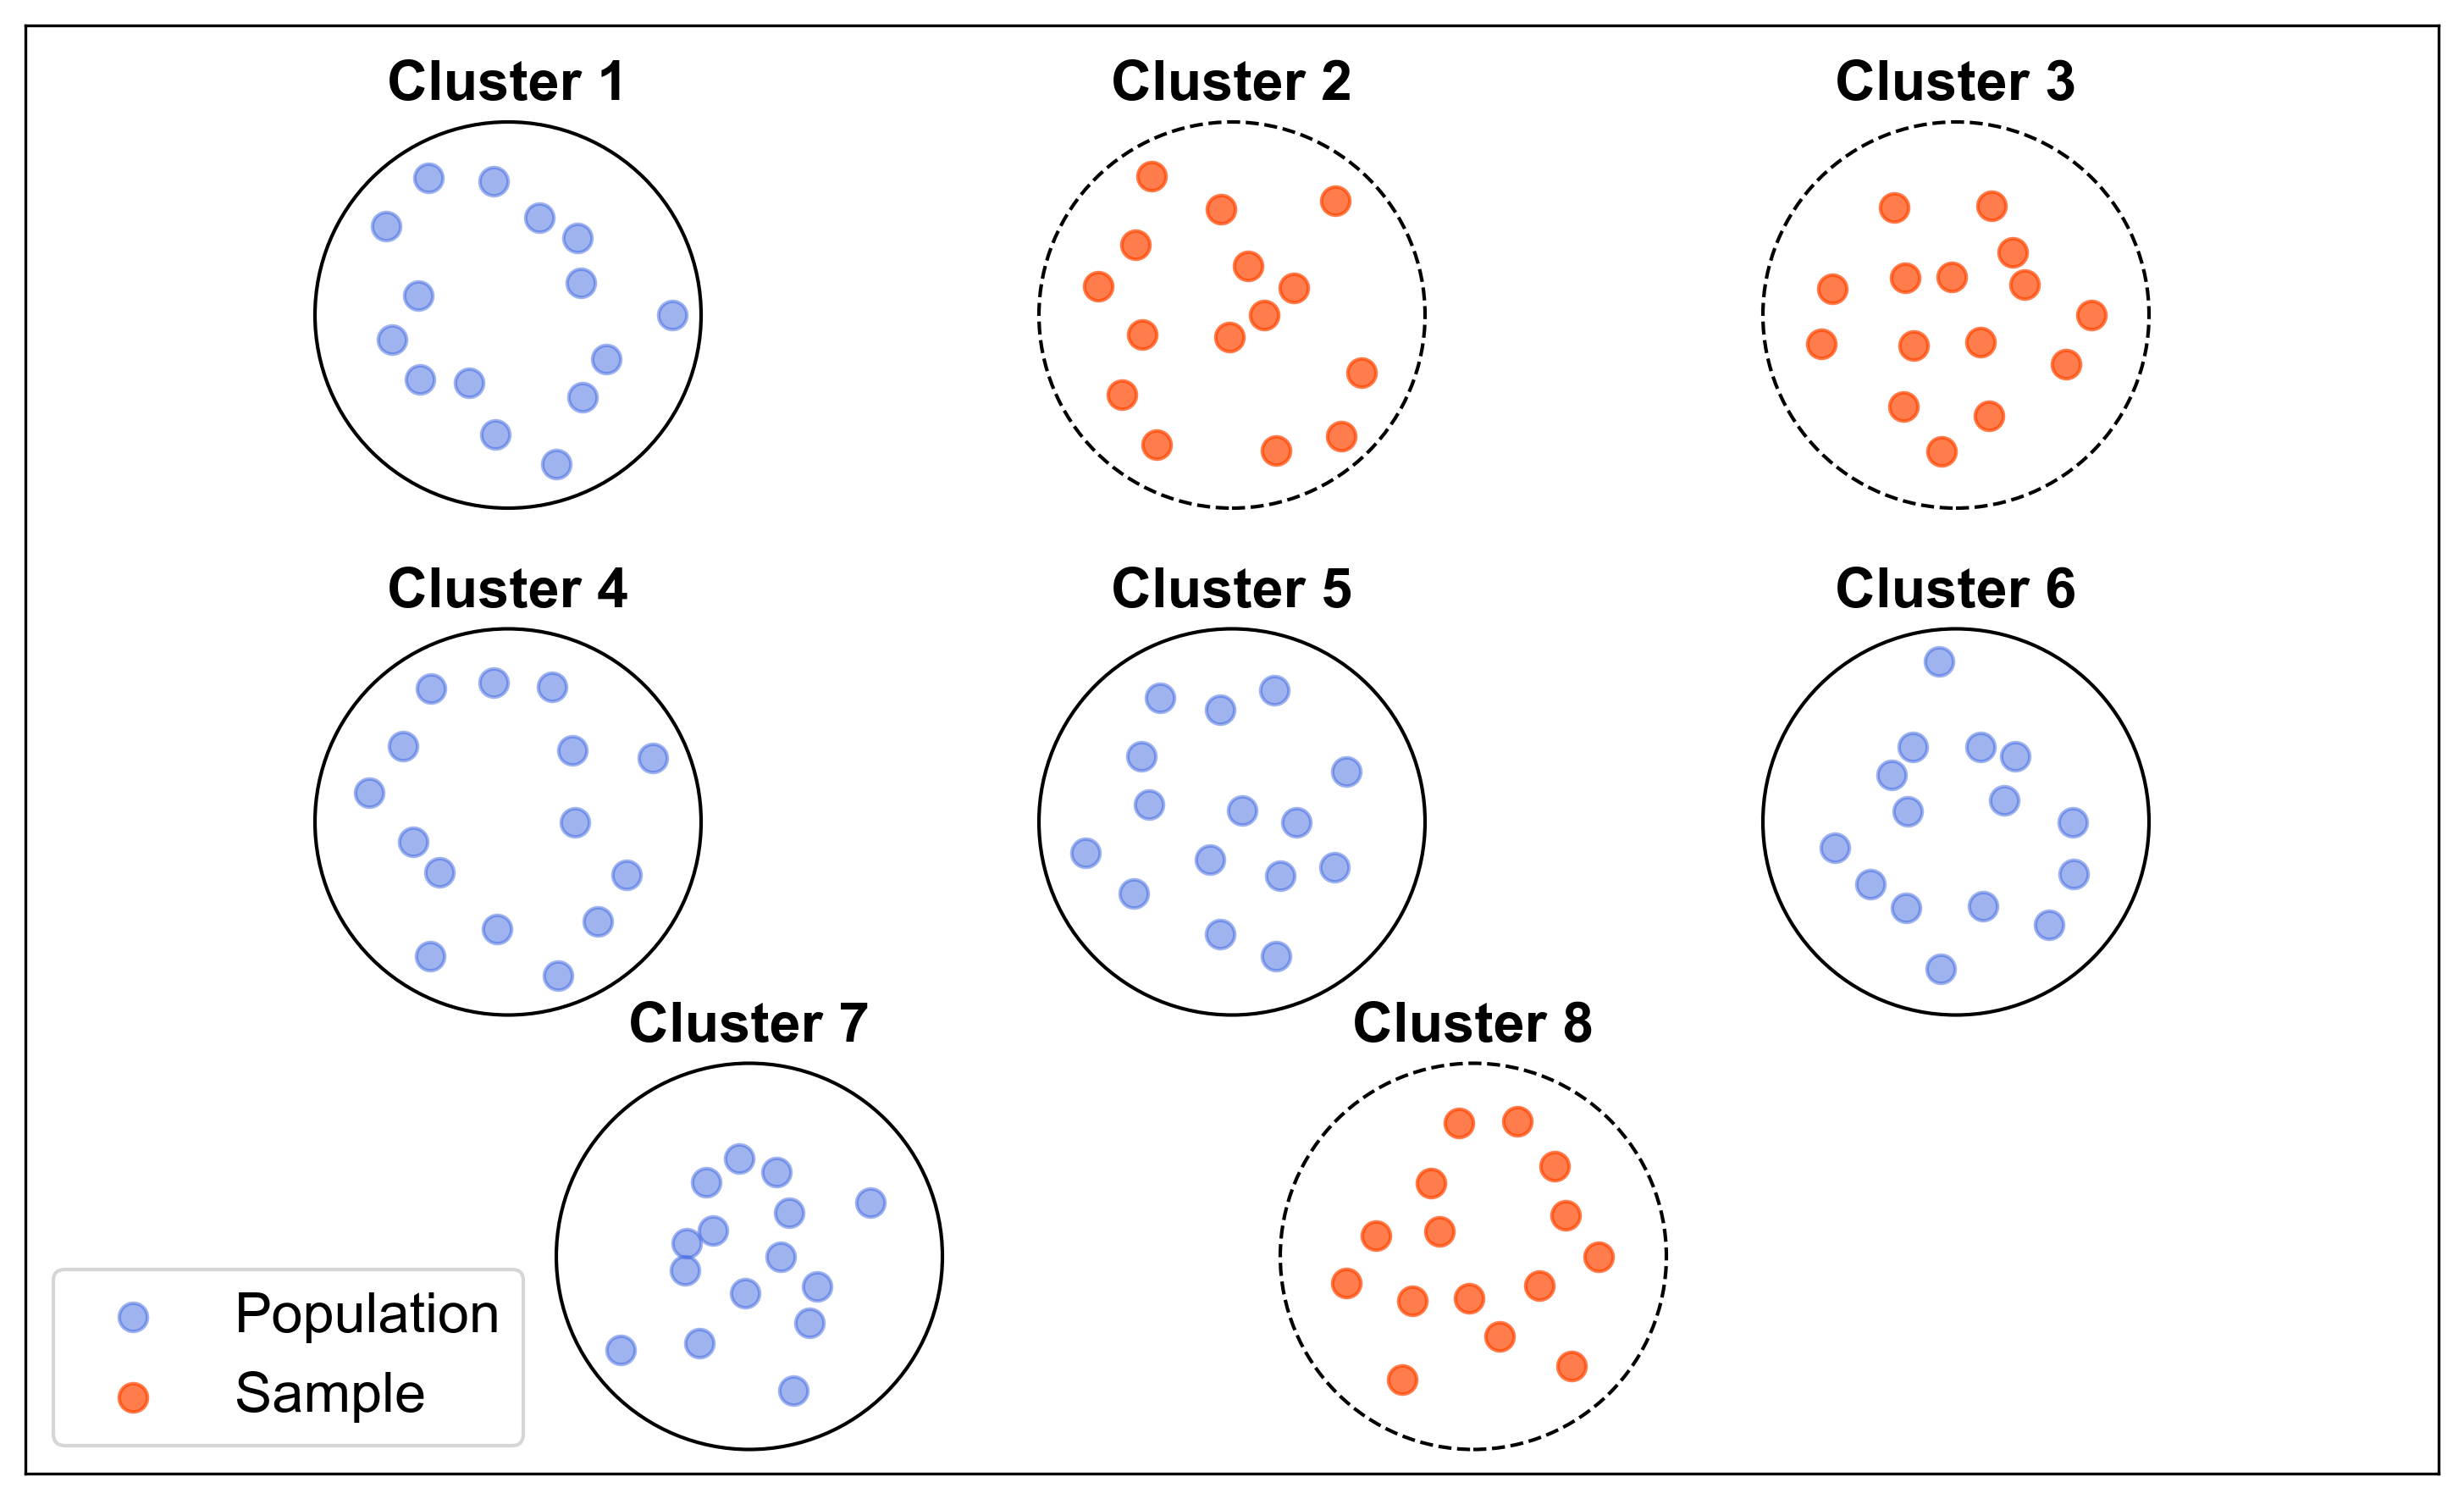
Fig. 1.5 illustrates a stratified sampling method where the population is divided into distinct strata (clusters). Each stratum is represented by a circle, and within each circle, there are 15 points. Out of these, 3 points are highlighted in red to represent the sample, while the remaining points are in blue, representing the population.

Fig. 1.5 Stratified Sampling Visualization: Each stratum contains a mix of population and sample points.#
Key features of the figure:
Stratum Centers: The centers of the strata are strategically placed to ensure clear separation.
Population Points: Blue points within each stratum represent the population.
Sample Points: Red points within each stratum represent the randomly selected sample.
Example 1.12
Imagine a public health researcher who wants to study the physical activity levels of high school students across a large country. The country has thousands of high schools spread across various regions, making it impractical to list and sample every student. Here’s how cluster sampling might be used:
Divide into Clusters: The researcher divides the country into clusters based on administrative regions, such as districts or cities.
Randomly Select Clusters: A random sample of these regions is chosen. Let’s say 10 out of 100 regions are selected.
Survey Entire Clusters: Instead of selecting individual students within each region, every student in the selected 10 regions is included in the study.
For instance, if the regions selected are diverse, including urban, rural, and suburban areas, the final sample will likely capture the variability in physical activity levels among high school students across the country.
This method saves time and resources but requires careful consideration to ensure that the selected clusters are as diverse and representative of the entire population as possible.
Note
Some of the key differences between stratified sampling and cluster sampling:
Stratified Sampling:
Purpose: To ensure representation of all subgroups (strata) within a population.
Process: The population is divided into strata based on specific characteristics, and a random sample is taken from each stratum.
Sample Diversity: Each stratum is sampled, which ensures diversity within the sample.
Efficiency: More efficient when each stratum is of interest and needs individual analysis.
Cost: Can be more expensive and time-consuming than cluster sampling due to the need to sample from each stratum.
Cluster Sampling:
Purpose: To reduce costs and logistical complexity when the population is large and geographically dispersed.
Process: The population is divided into clusters (often geographically), and entire clusters are randomly selected.
Sample Diversity: The sample may be less diverse because it includes all members of selected clusters, which might be homogenous.
Efficiency: More efficient in terms of logistics and cost when the population is too large or spread out for simple random sampling.
Cost: Generally less expensive and quicker than stratified sampling, especially for large-scale studies.
stratified sampling is used when you want to ensure that specific subgroups are proportionately represented in your sample, while cluster sampling is more about practicality and cost-effectiveness when dealing with large, spread-out populations. Stratified sampling is more likely to yield a representative sample, but cluster sampling can be more feasible for large-scale studies.
1.3.4. Systematic Sampling#
Systematic sampling is a streamlined form of probability sampling that offers a balance between simplicity and the randomness of simple random sampling [Thompson, 2012]. Here’s how it’s typically done:
Start Point: Choose a random starting point on a list of the population.
Interval Selection: Determine a fixed interval (n), known as the sampling interval.
Sample Selection: Select every nth element from the list, beginning with the chosen start point.
This method is beneficial when you have a complete list of the population or when the population is naturally ordered. It’s simpler than simple random sampling because once you’ve set your interval, you can quickly select your sample without further randomization.
However, if the population has a cyclical pattern, systematic sampling might inadvertently pick a biased sample. For example, if you’re sampling households in a neighborhood and houses are arranged in a pattern that repeats every nth house, you could end up with a non-representative sample. Therefore, it’s crucial to ensure the population doesn’t have a repeating pattern that aligns with the sampling interval.
Example 1.13
Imagine a researcher who wants to survey employees in a large corporation with 1,000 employees. The goal is to select a sample of 100 employees to understand job satisfaction levels. Here’s how systematic sampling could be applied:
List the Population: The researcher compiles a list of all 1,000 employees.
Determine the Sampling Interval: Since the desired sample size is 100 employees, the sampling interval (\(k\)) is calculated by dividing the population size by the sample size:
Random Starting Point: A random starting point between 1 and 10 is chosen. Let’s say the number 7 is selected.
Select the Sample: Starting with the 7th employee on the list, the researcher selects every 10th employee thereafter. This means the sample will include the 7th, 17th, 27th, … up to the 997th employee.
This systematic approach ensures that the sample is spread evenly across the entire population list, providing a representative snapshot of employee job satisfaction within the corporation.
1.3.5. Convenience Sampling#
Convenience sampling is a non-probabilistic sampling technique where participants are selected based on their ease of access and readiness to take part in the study [Thompson, 2012]. It’s characterized by:
Ease of Access: Participants are chosen because they are easy to reach.
Voluntary Participation: Individuals are included in the sample because they are willing to participate.
Use Cases: Often employed when there are constraints such as limited time, budget, or logistical challenges that prevent random sampling.
Potential Biases: The sample may not accurately represent the broader population and could be biased.
Limitations: Results from convenience sampling may lack generalizability, and findings should be interpreted with caution.
Researchers use convenience sampling primarily for exploratory research or when other methods are impractical, but they must be mindful of its limitations regarding accuracy and representation.
Example 1.14
Imagine a researcher conducting a study on people’s coffee-drinking habits. The researcher decides to use convenience sampling for the study. Here’s how it might unfold:
Location Selection: The researcher chose a popular coffee shop in the city center because it’s easily accessible and frequented by a diverse group of people.
Participant Recruitment: Over a week, the researcher approaches customers at the coffee shop and asks if they would be willing to complete a short survey about their coffee consumption.
Data Collection: Those who agree are given the survey on the spot to fill out. The researcher continues this process until a sufficient number of responses are collected.
In this scenario, the sample consists of coffee shop customers who are available and willing to participate. While this method is quick and convenient, it may not provide a sample that’s representative of all coffee drinkers, as it excludes those who don’t visit that particular shop or who visit at different times. The results of the study should be interpreted with the understanding that they may reflect the habits of this specific group rather than the general population.
1.3.6. With Replacement or Without Replacement#
True random sampling is a method of selecting a subset of individuals from a population such that each individual has an equal probability of being chosen. This method requires replacement, meaning that after an individual is selected, they are returned to the population and can be selected again. However, for practical reasons, many situations use simple random sampling without replacement, which avoids selecting the same individual twice. When the population is large and the sample is small, the results of sampling without replacement are similar to those of sampling with replacement, because the chance of selecting the same individual twice with replacement is very low [Diez et al., 2019].
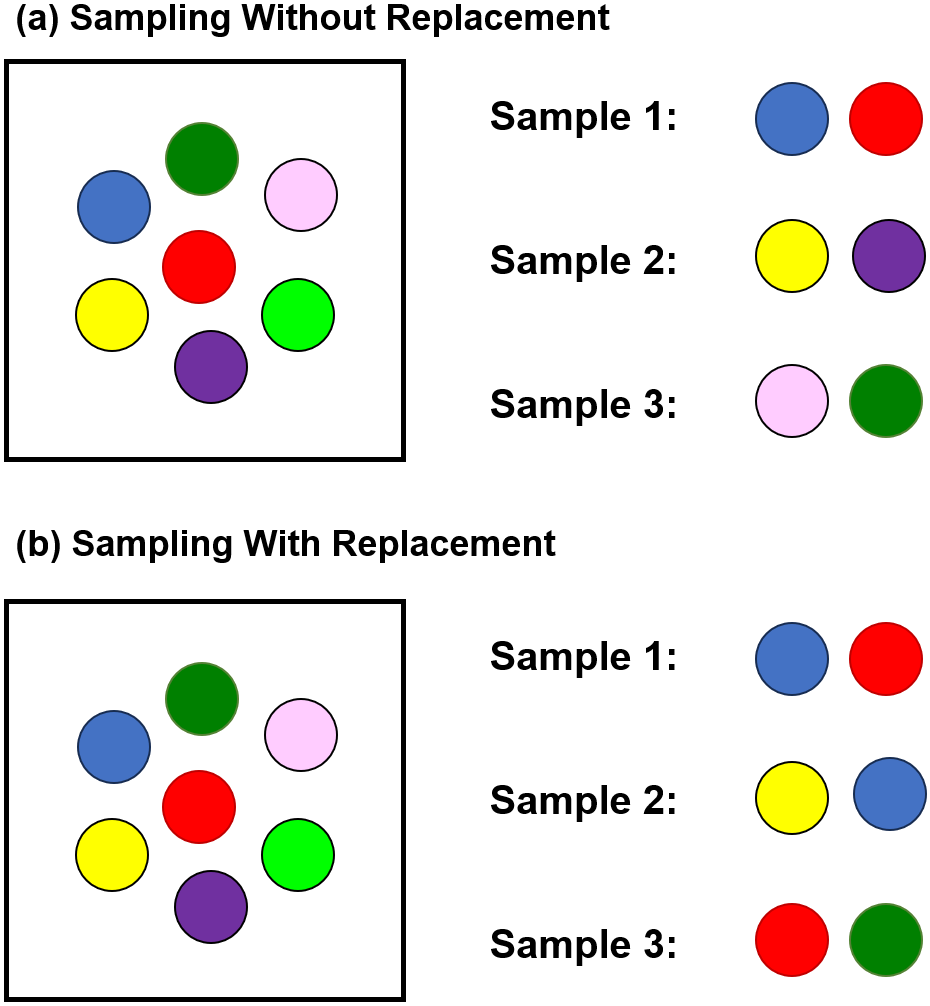
Fig. 1.6 illustrates two sampling methods used in statistics:
Sampling Without Replacement: In this method, once an item is selected, it cannot be selected again for that sample set. This is shown in part (a) where each sample set (Sample 1, Sample 2, and Sample 3) contains different combinations of colored circles without any repetitions.
Sampling With Replacement: In this method, after an item is selected, it is replaced before drawing the next one, allowing the same item to be selected more than once within different sample sets. This is shown in part (b) where the colored circles are repeated across the sample sets.

Fig. 1.6 Sampling with replacement or without replacement.#
1.3.7. Sampling Errors and Non-sampling errors#
Sampling errors and non-sampling errors are two types of errors that can affect the quality and validity of data analysis. Sampling errors arise from the sampling process itself, such as when the sample size is too small or the sampling design is inappropriate for the research question. Non-sampling errors result from factors that are not related to the sampling process, such as measurement errors, nonresponse errors, or data processing errors. Sampling errors are unavoidable, as a sample will never be a perfect representation of the population, but they can be estimated and reduced by using appropriate sampling techniques and increasing the sample size. Non-sampling errors are more difficult to measure and control, but they can be minimized by ensuring the reliability and validity of the data collection instruments, methods, and procedures [Roy et al., 2016].
