3.3. The Addition Rule#
3.3.1. Union of Events#
Let’s use A and B to represent two events of a sample space \(S\) and explain the concept of the union of events (\(A \bigcup B\)) with the help of a Venn diagram. In probability theory, events are subsets of the sample space \(S\), which consists of all possible outcomes of an experiment. When we have two events \(A\) and \(B\), the union of these events (\(A \bigcup B\)) is defined as the event that occurs if either \(A \bigcup B\) occurs, or if both A and B occur.
Fig. 3.18 displays a Venn diagram consisting of two overlapping circles within a rectangular area. The left circle is labeled \(A\) and shaded with red diagonal lines, while the right circle is labeled \(B\) and shaded with blue horizontal lines. The overlapping section represents elements common to both sets \(A\) and \(B\), indicated by the interlacing of red diagonal and blue horizontal lines. The rectangular area represents the universal set \(S\), encompassing both sets \(A\) and \(B\).
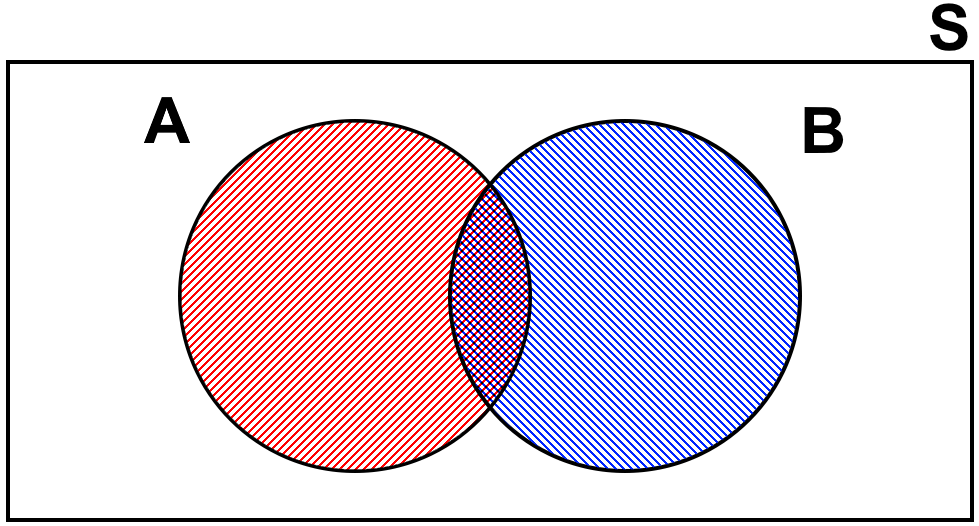
Fig. 3.18 Venn Diagram Illustrating the Intersection of Sets A and B within Universal Set \(S\).#
The concept of the union of events can be extended to more than two events. If we have three events, \(A\), \(B\), and \(C\), the union of these events (\(A\bigcup B \bigcup C\)) is the event that occurs if at least one of the events \(A\), \(B\), or \(C\) occurs. This can be visualized using a Venn diagram with three overlapping circles, each representing one of the events. The union of the three events includes all the areas covered by any of the three circles.
In general, for any number of events \(A_1, A_2, \ldots, A_n\), the union (\(A_1 \bigcup A_2 \bigcup \ldots \bigcup A_n\)) is the event that occurs if at least one of the events \(A_i\) occurs for \(i = 1, 2, \ldots, n\).
3.3.2. Intersection of Events#
When considering any two events, A and B (or \(A \& B\)), we can define another event denoted as \(A \bigcap B\), referred to as the intersection of A and B. This new event encompasses all possible outcomes that are common to both A and B. In other words, the event \(A \bigcap B\) will happen only when both events A and B occur simultaneously.
Fig. 3.19 features a Venn diagram with two overlapping circles inside a rectangle. The left circle is labeled \(A\) and the right circle is labeled \(B\). The overlapping area of the circles is shaded with red dots, and the rectangle surrounding the circles is labeled \(S\). This diagram visually represents the logical relationships between two sets within a universal set, commonly used in fields like probability, logic, statistics, and set theory to depict elements that are common to both sets.
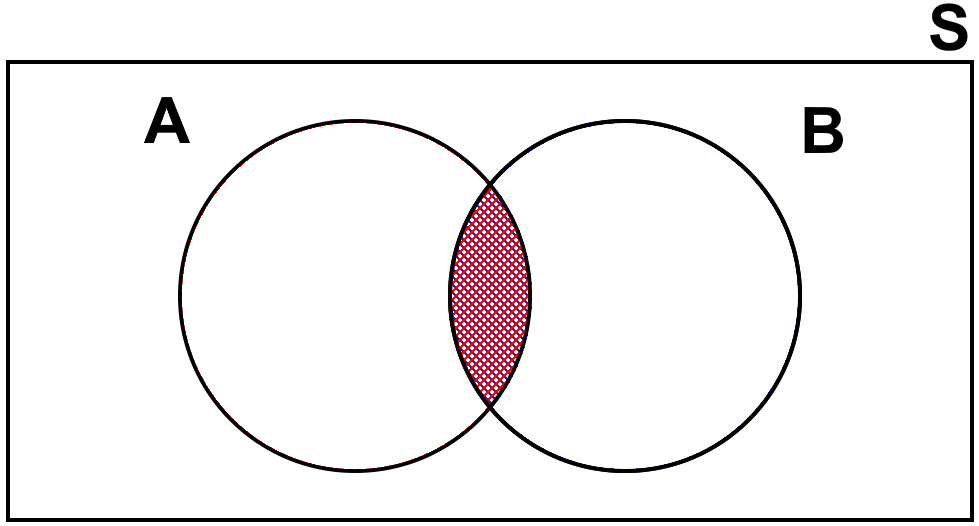
Fig. 3.19 Venn Diagram Showing the Intersection of Sets A and B within Universal Set \(S\).#
The concept of the intersection of events can be extended to more than two events. If we have three events, \(A\), \(B\), and \(C\), the intersection of these events (\(A \bigcap B \bigcap C\)) is the event that occurs only if all three events \(A\), \(B\), and \(C\) occur simultaneously. This can be visualized using a Venn diagram with three overlapping circles, each representing one of the events. The intersection of the three events includes only the area where all three circles overlap.
In general, for any number of events \(A_1, A_2, \ldots, A_n\), the intersection (\(A_1 \bigcap A_2 \bigcap \ldots \bigcap A_n\)) is the event that occurs only if all the events \(A_i\) occur simultaneously for \(i = 1, 2, \ldots, n\).
3.3.3. Mutually Exclusive Events#
Two events, A and B, are mutually exclusive if their intersection, \(A \bigcap B\), is an empty set (\(\emptyset\)), which means that A and B cannot occur simultaneously. The empty set (\(\emptyset\)) is also known as the null event or the empty set.
Fig. 3.20 shows a Venn diagram with two overlapping circles inside a rectangle. The left circle is labeled \(A\) and the right circle is labeled \(B\). The overlapping area of the circles is shaded with red dots, and the rectangle surrounding the circles is labeled \(S\). This diagram visually represents the logical relationships between two sets within a universal set, commonly used in fields like probability, logic, statistics, and set theory to depict elements that are common to both sets.

Fig. 3.20 Venn Diagram Depicting the Intersection of Sets A and B within Universal Set \(S\).#
Example 3.10 (Concept of two and three mutually events)
Fig. 3.21 illustrates the concept of two mutually events:

Fig. 3.21 (Left) Illustrates two mutually exclusive events, where the occurrence of one event completely rules out the occurrence of the other. (Right) Depicts two non-mutually exclusive events, indicating that both events can occur at the same time.#
Fig. 3.22 illustrates the concept of three mutually events:
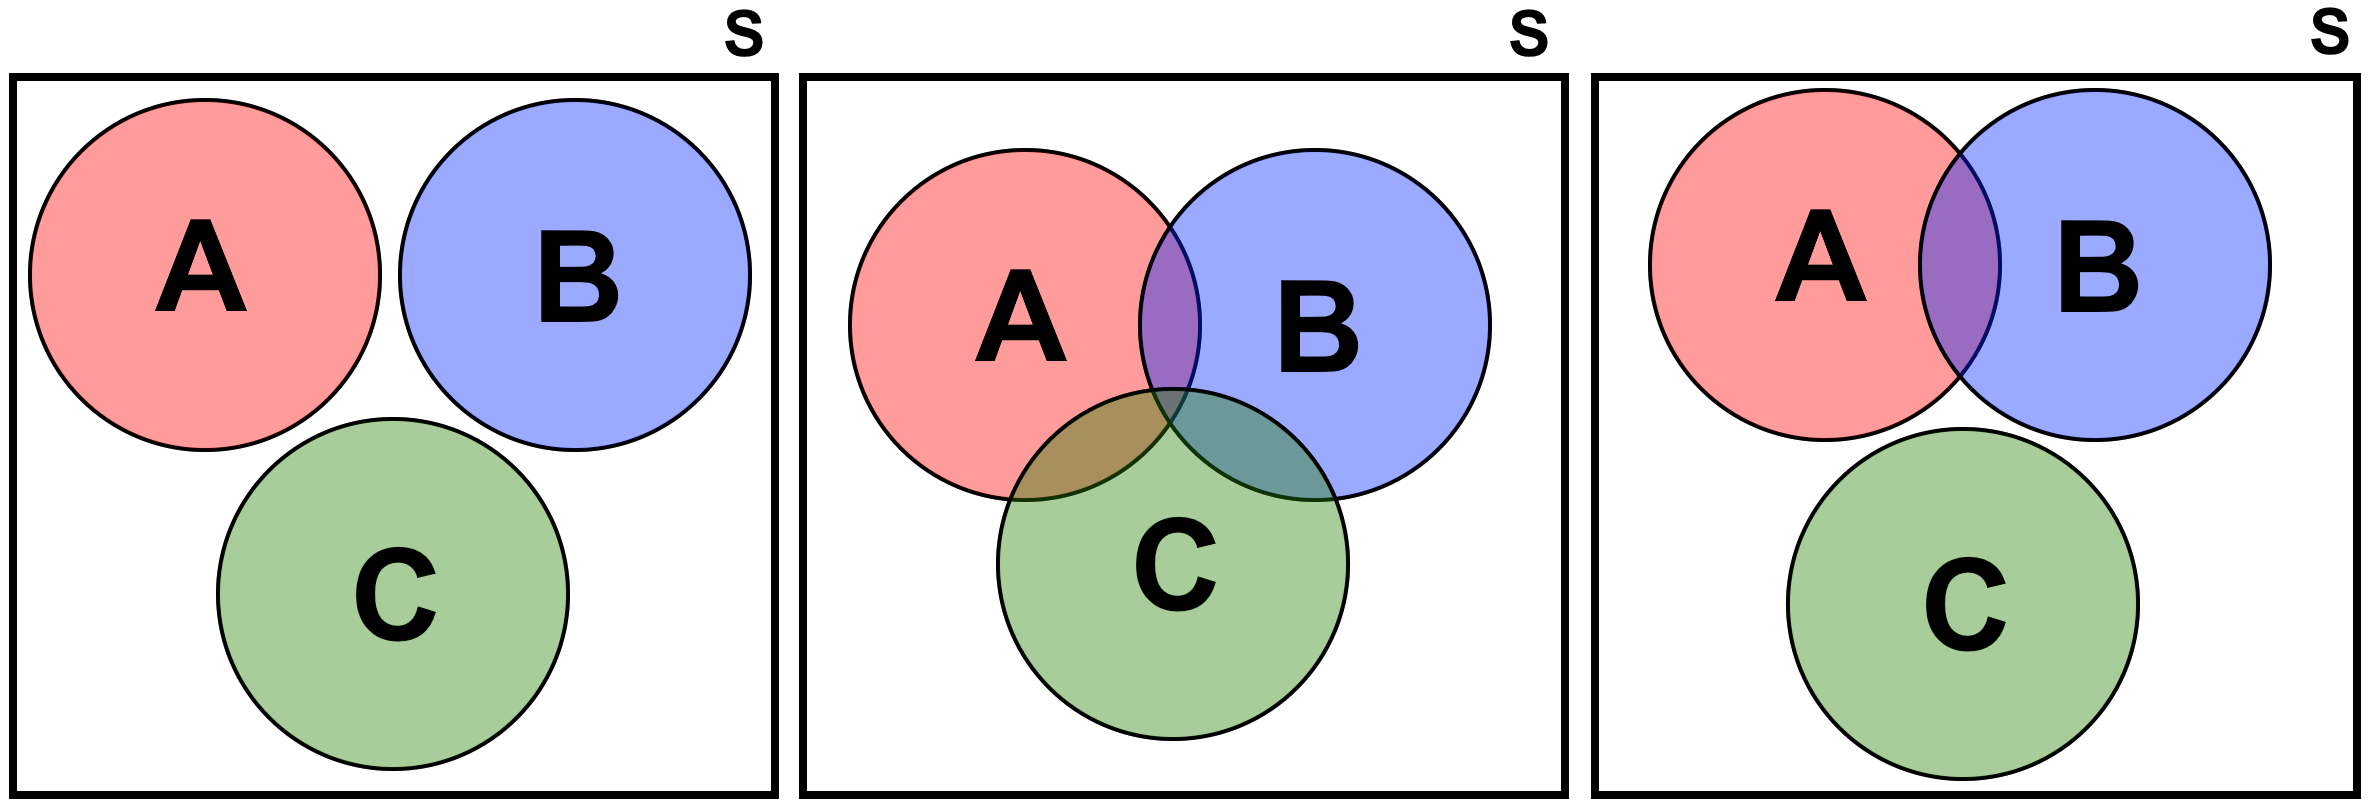
Fig. 3.22 (Left) Shows three mutually exclusive events, none of which can occur simultaneously with any other. (Center) Shows three non-mutually exclusive events, where there is a possibility of overlap between the events. (Right) Also shows three non-mutually exclusive events, further emphasizing the potential for events to co-occur.#
Example 3.11 (Rolling a Die)
Consider a six-sided die with faces numbered from 1 to 6. Let event A be “rolling a 2” and event B be “rolling a 5”. These two events are mutually exclusive because they cannot happen at the same time. When you roll the die, it can land on only one number. Therefore, the probability of both A and B occurring together is zero:
The probability of rolling a ‘2’ (event A) is \( \dfrac{1}{6} \), and the probability of rolling a ‘5’ (event B) is also \( \dfrac{1}{6} \). Since they cannot occur together, the probability of A and B occurring at the same time (A intersect B) is 0. This is represented by the empty set \( \emptyset \), which has no elements because there is no outcome where the die shows both a ‘2’ and a ‘5’ at the same time.
Example 3.12
Given the experiment with 12 outcomes, each equally likely, and events A and B defined as follows:
Event A: A = {1, 2, 3, 4, 5, 6}
Event B: B = {6, 7, 8, 9}
Perform the following tasks:
a. Determine the intersection of events A and B.
b. Determine the union of events A and B.
c. Construct a Venn diagram to visually represent events A and B, their intersection, and their union.
Solution:
a. The intersection of events A and B (A AND B) is the set of outcomes common to both A and B. In this case, it is the set {6}.
b. The union of events A and B (A OR B) is the set of all outcomes that belong to either A, B, or both. This is the set {1, 2, 3, 4, 5, 6, 7, 8, 9}.
c. Now, let’s plot the Venn diagram:
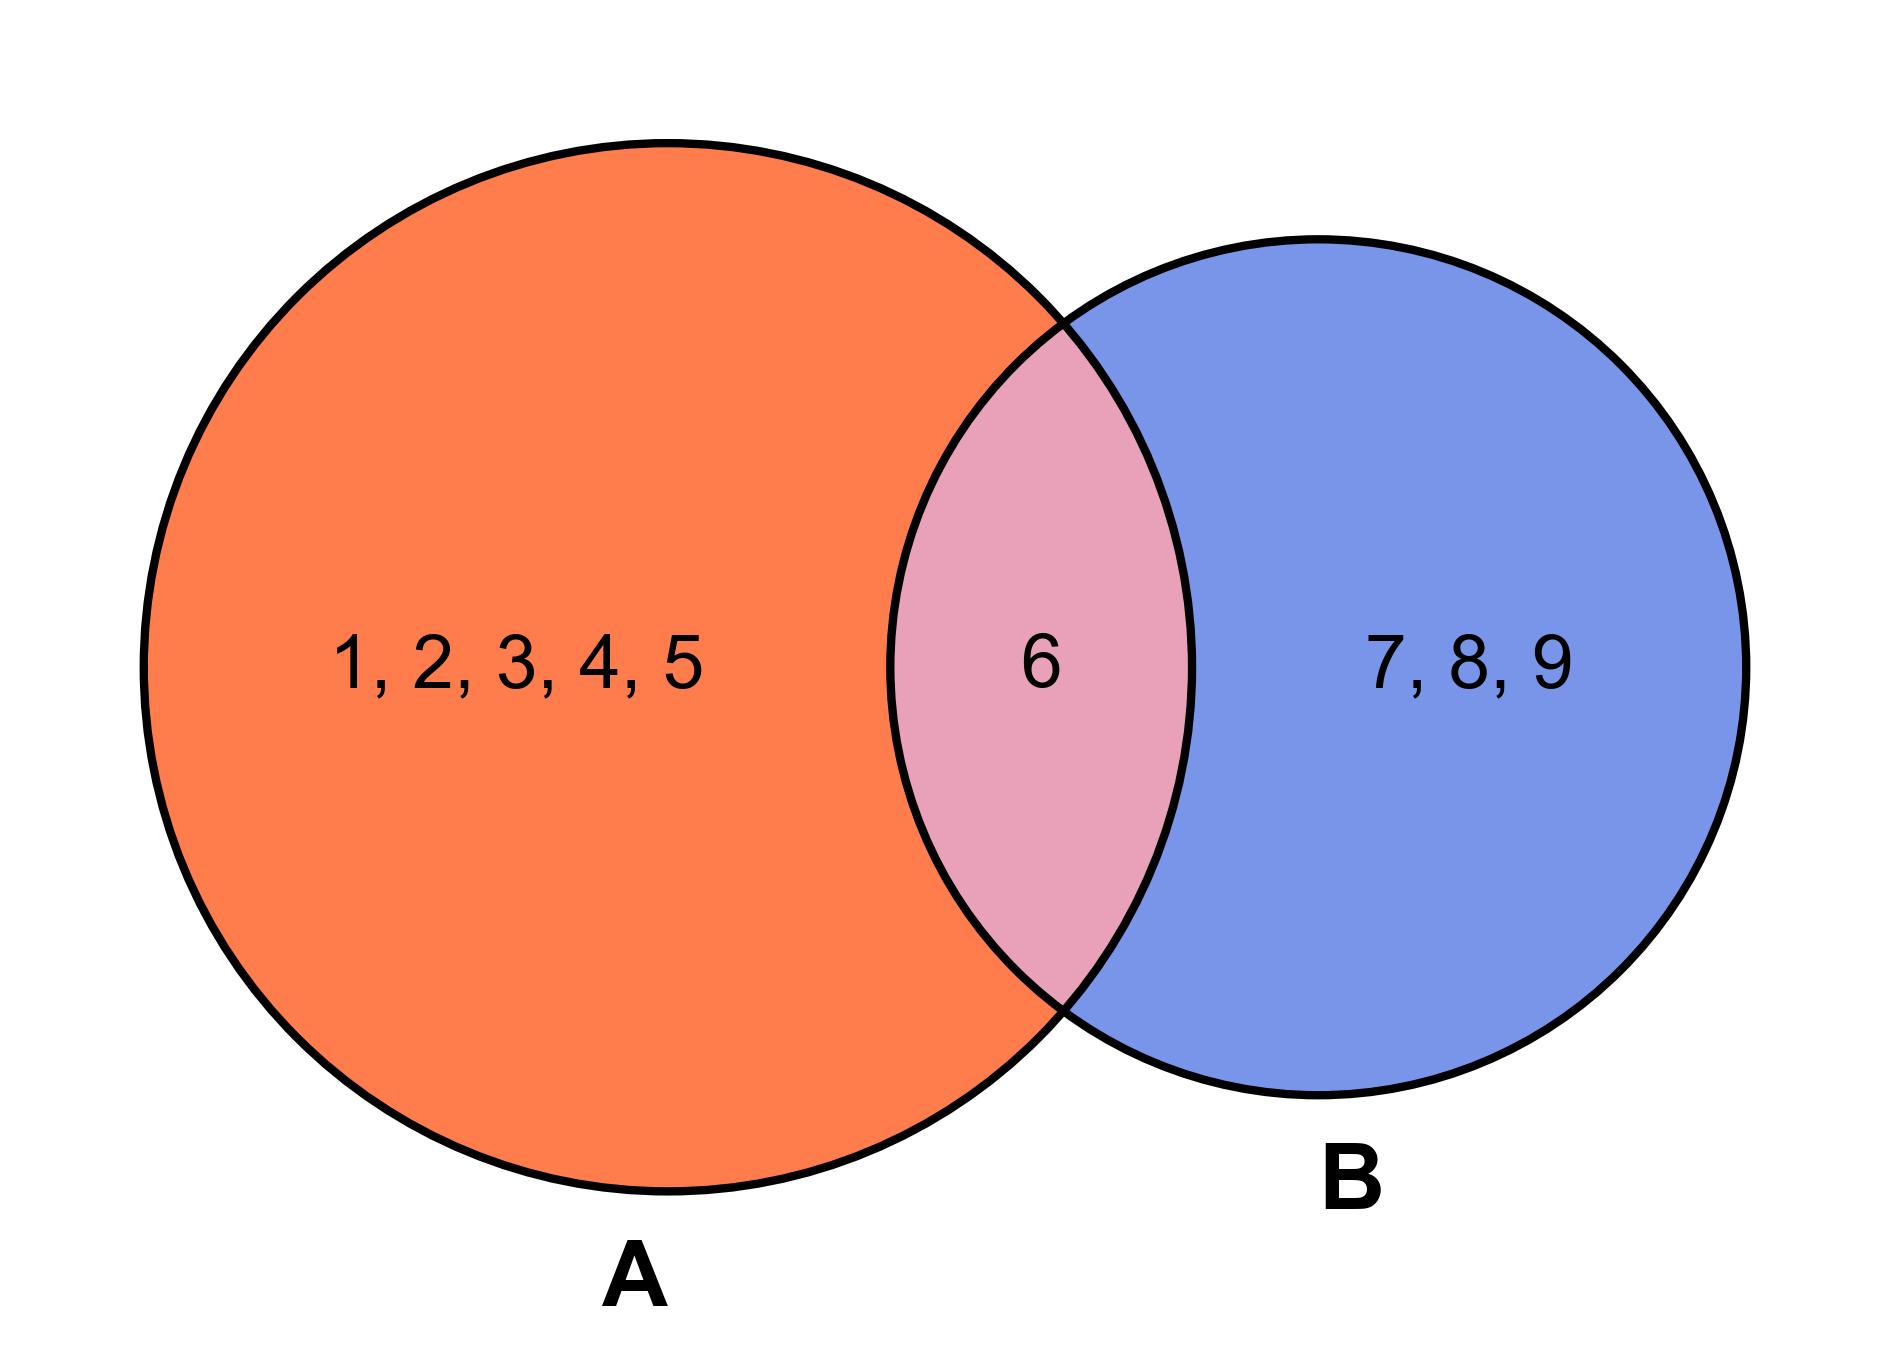
Fig. 3.23 Venn diagram for Events A and B#
The Venn diagram visually represents:
Event A: The red circle containing {1, 2, 3, 4, 5, 6}
Event B: The blue circle containing {6, 7, 8, 9}
Intersection (A ∩ B): The overlapping region containing {6}
Union (A ∪ B): The entire colored area containing {1, 2, 3, 4, 5, 6, 7, 8, 9}
Example 3.13
Given an experiment with 15 outcomes, each equally likely, and events C and D defined as follows:
Event C: C = {1, 2, 3, 4, 5, 6, 7, 8}
Event D: D = {4, 5, 6, 10, 11, 12}
Perform the following tasks:
a. Determine the intersection of events C and D.
b. Determine the union of events C and D.
c. Construct a Venn diagram to visually represent events C and D, their intersection, and their union.
Solution:
a. The intersection of events C and D (C AND D) is the set of outcomes common to both C and D. In this case, it is the outcome \begin{equation*}{4, 5, 6}\end{equation*}.
b. The union of events C and D (C OR D) is the set of all outcomes that belong to either C, D, or both. This is the set \begin{equation*}{1, 2, 3, 4, 5, 6, 7, 8, 10, 11, 12}\end{equation*}.
c. Now, let’s plot the Venn diagram:
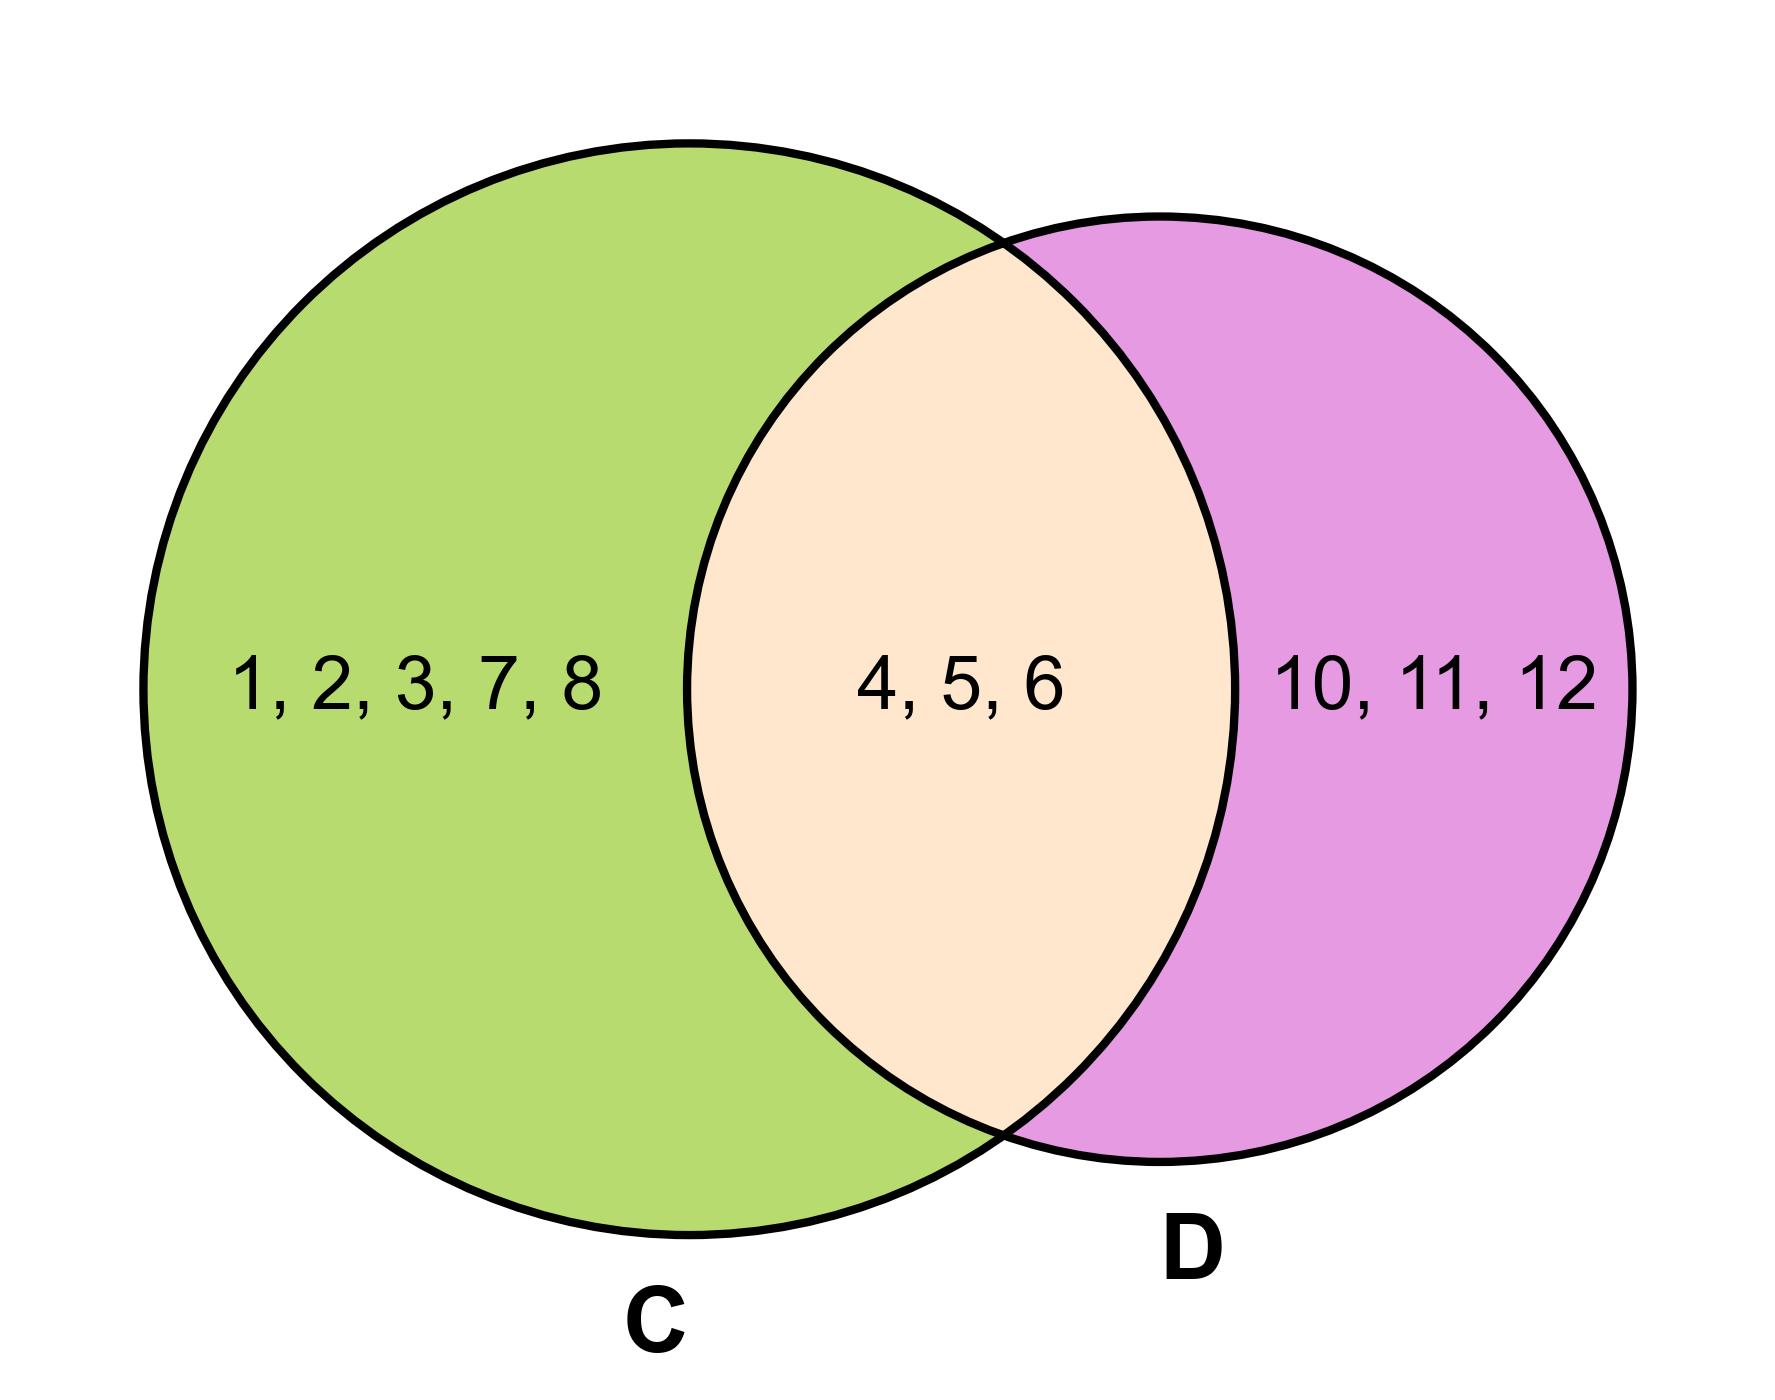
Fig. 3.24 Venn diagram for Events C and D#
The Venn diagram visually represents:
Event C: The green circle containing {1, 2, 3, 4, 5, 6, 7, 8}
Event D: The purple circle containing {4, 5, 6, 10, 11, 12}
Intersection (C ∩ D): The overlapping region containing {4, 5, 6}
Union (C ∪ D): The entire colored area containing {1, 2, 3, 4, 5, 6, 7, 8, 10, 11, 12}
3.3.4. The Addition Rule in Probability#
The Addition Rule is a fundamental concept in probability that helps us calculate the probability of the occurrence of at least one of two events. It is formally stated as:
This rule accounts for the fact that when we add the probabilities of two events, we must subtract the probability of their intersection to avoid double-counting.
Mutually Exclusive Events: When two events, A and B, are mutually exclusive, they cannot occur simultaneously. In such cases, the intersection of A and B is empty, meaning:
Therefore, the Addition Rule simplifies to:
Example 3.14 (Drawing Marbles)
You have a bag containing 50 marbles: 15 red, 10 blue, and 25 of various other colors. You will draw one marble from the bag.
What is the probability of drawing a marble that is neither red nor blue?
Solution:
15 Marbles
10 Marbles
25 Marbles
The most straightforward approach to solve this problem is to directly calculate the probability of drawing a marble that is neither red nor blue:
However, we can also utilize the addition rule to solve this problem. Let’s define two events:
Event A: Drawing a red marble
Event B: Drawing a blue marble
The probability of drawing either a red or blue marble is:
Now, the probability of drawing a marble that is neither red nor blue is the complement of this probability:
Note
While we haven’t formally discussed complements yet, it’s worth noting that since the total probability must equal 1, we can find the probability of an event not occurring by subtracting the probability of it occurring from 1.
Generalization for Multiple Mutually Exclusive Events
If we have a set of mutually exclusive events A, B, C, …, the probability of any one of these events occurring is the sum of their individual probabilities:
Example 3.15 (Rolling a Dice)
Consider rolling a single six-sided die. Let event \(A\) be rolling an even number, and event \(B\) be rolling a number greater than 4.
a. Are events \(A\) and \(B\) mutually exclusive?
b. Calculate the probability of rolling an even number.
c. Calculate the probability of rolling a number greater than 4.
d. Calculate the probability of rolling either an even number or a number greater than 4.
Solution:
a. No, events \(A\) and \(B\) are not mutually exclusive because there are outcomes that are both even and greater than 4 (specifically, rolling a 6).
b. The even numbers on a six-sided die are 2, 4, and 6. There are 3 even numbers out of 6 possible outcomes.
c. The numbers greater than 4 on a six-sided die are 5 and 6. There are 2 such numbers out of 6 possible outcomes.
d. Since events \(A\) and \(B\) are not mutually exclusive, we need to use the formula for the union of two events:
We already have \(P(A)\) and \(P(B)\). Now, we need to find \(P(A \cap B)\), the probability of rolling a number that is both even and greater than 4. The only such number is 6.
Now, we can calculate \(P(A \cup B)\):
Converting all fractions to have a common denominator of 6:
So, the probability of rolling either an even number or a number greater than 4 is \(\dfrac{2}{3}\).
Example 3.16 (Probability with a Deck of Cards)
A standard deck of playing cards contains 52 cards, divided into four suits: hearts, diamonds, clubs, and spades. Each suit has 13 cards: Ace through 10, and the face cards: Jack, Queen, and King.
Find:
a) Probability of Drawing a Jack or a Red Card.
b) Probability of Drawing a Card That Is Not a Heart.
c) Probability of Drawing a Spade or a Face Card
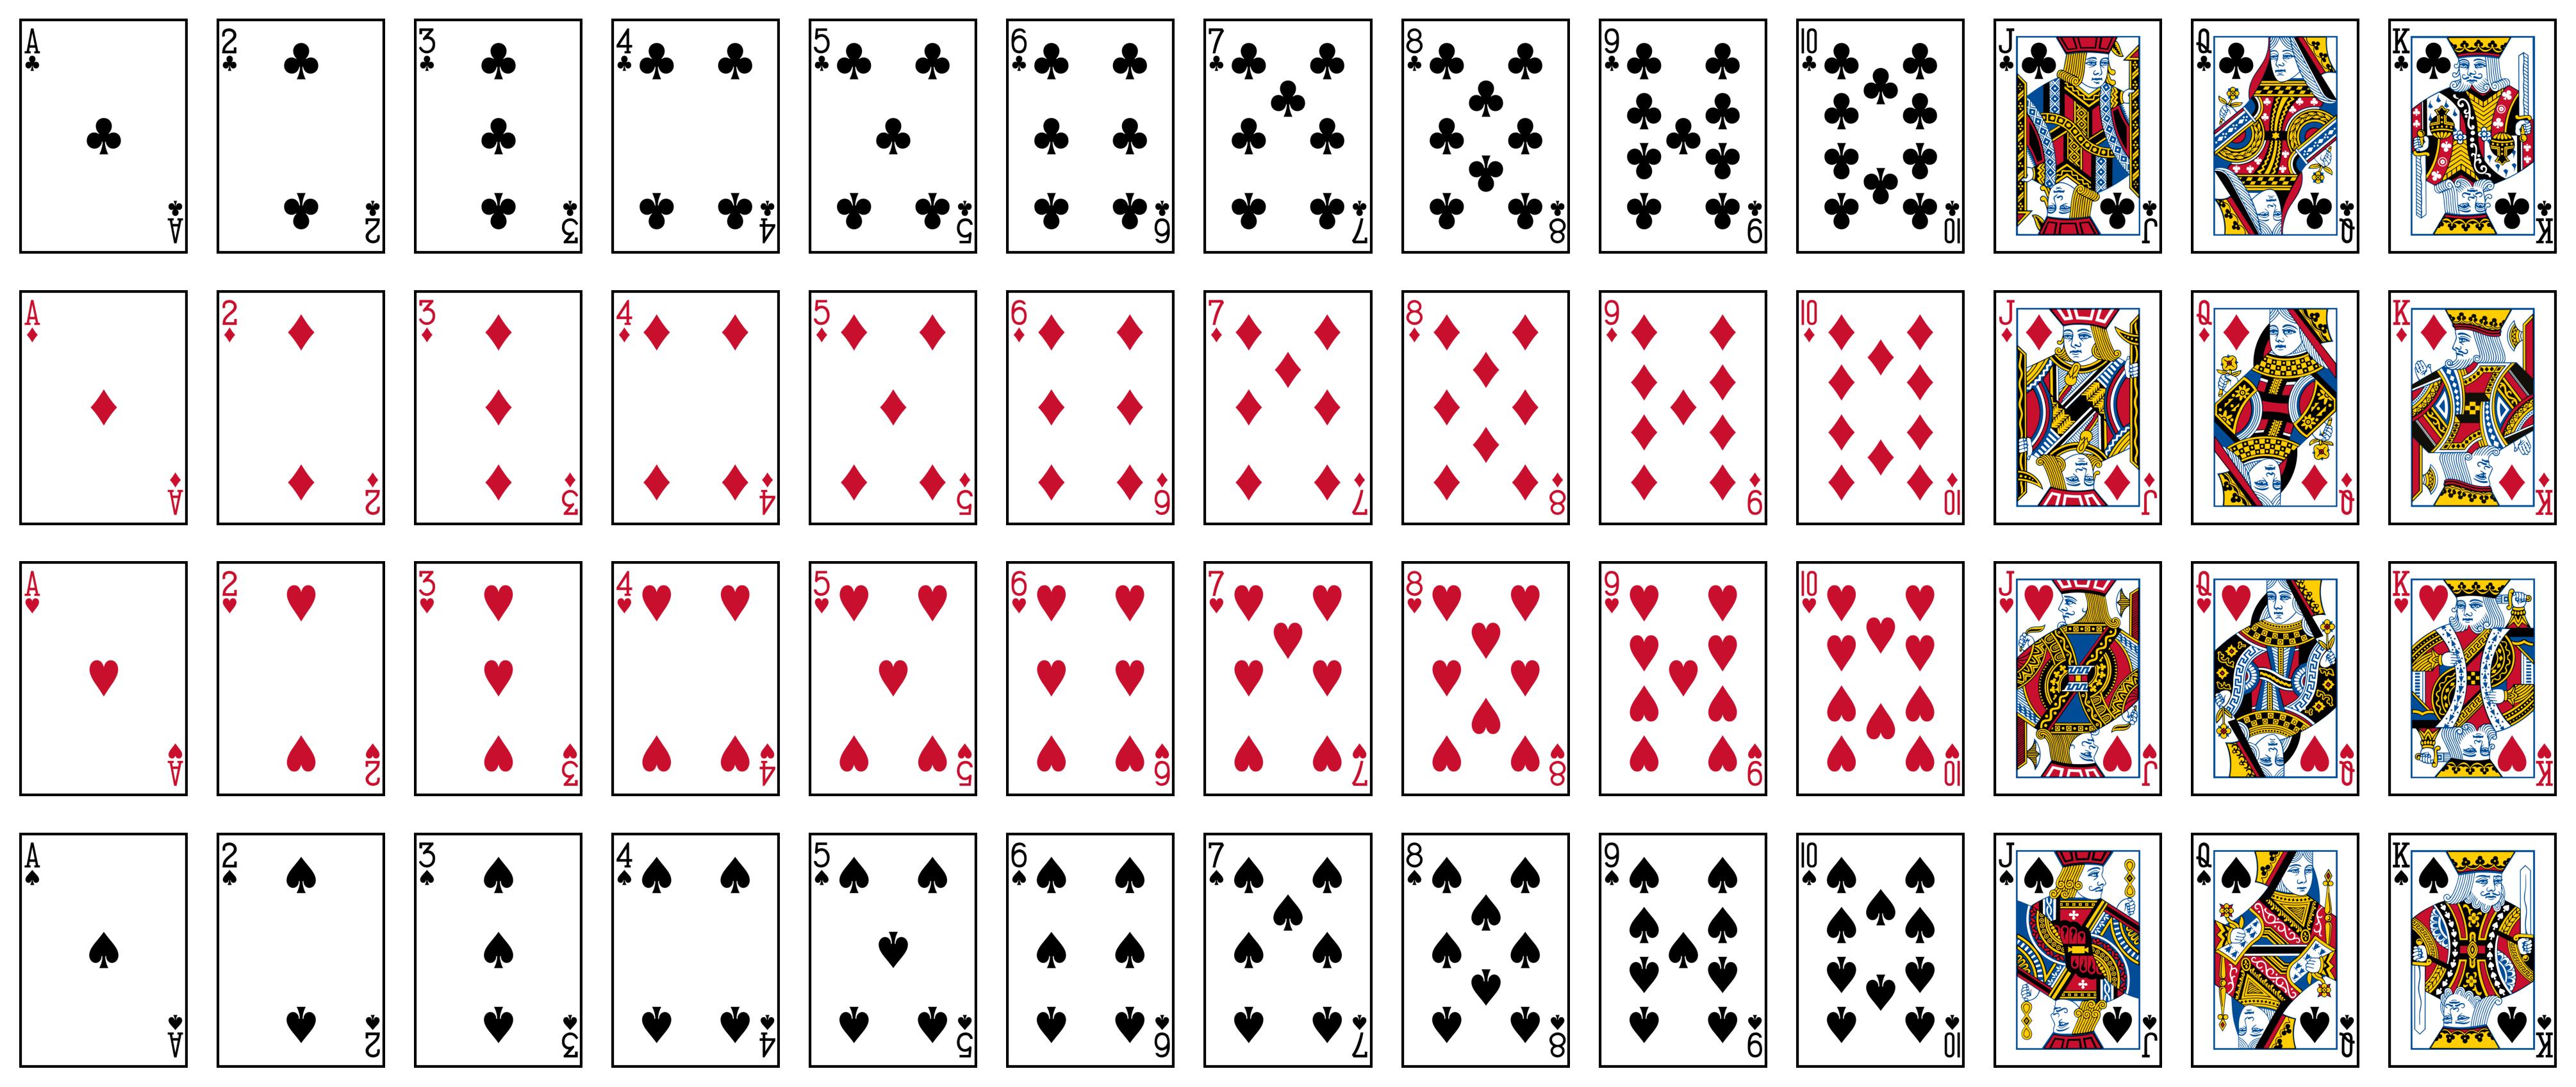
Fig. 3.25 A standard deck of playing cards. Image generated based on this source.#
Solution:
a) Probability of Drawing a Jack or a Red Card: Let \( J \) be the event of drawing a Jack and \( R \) be the event of drawing a red card. We have:
There are 4 Jack cards:
There are 26 Red cards:
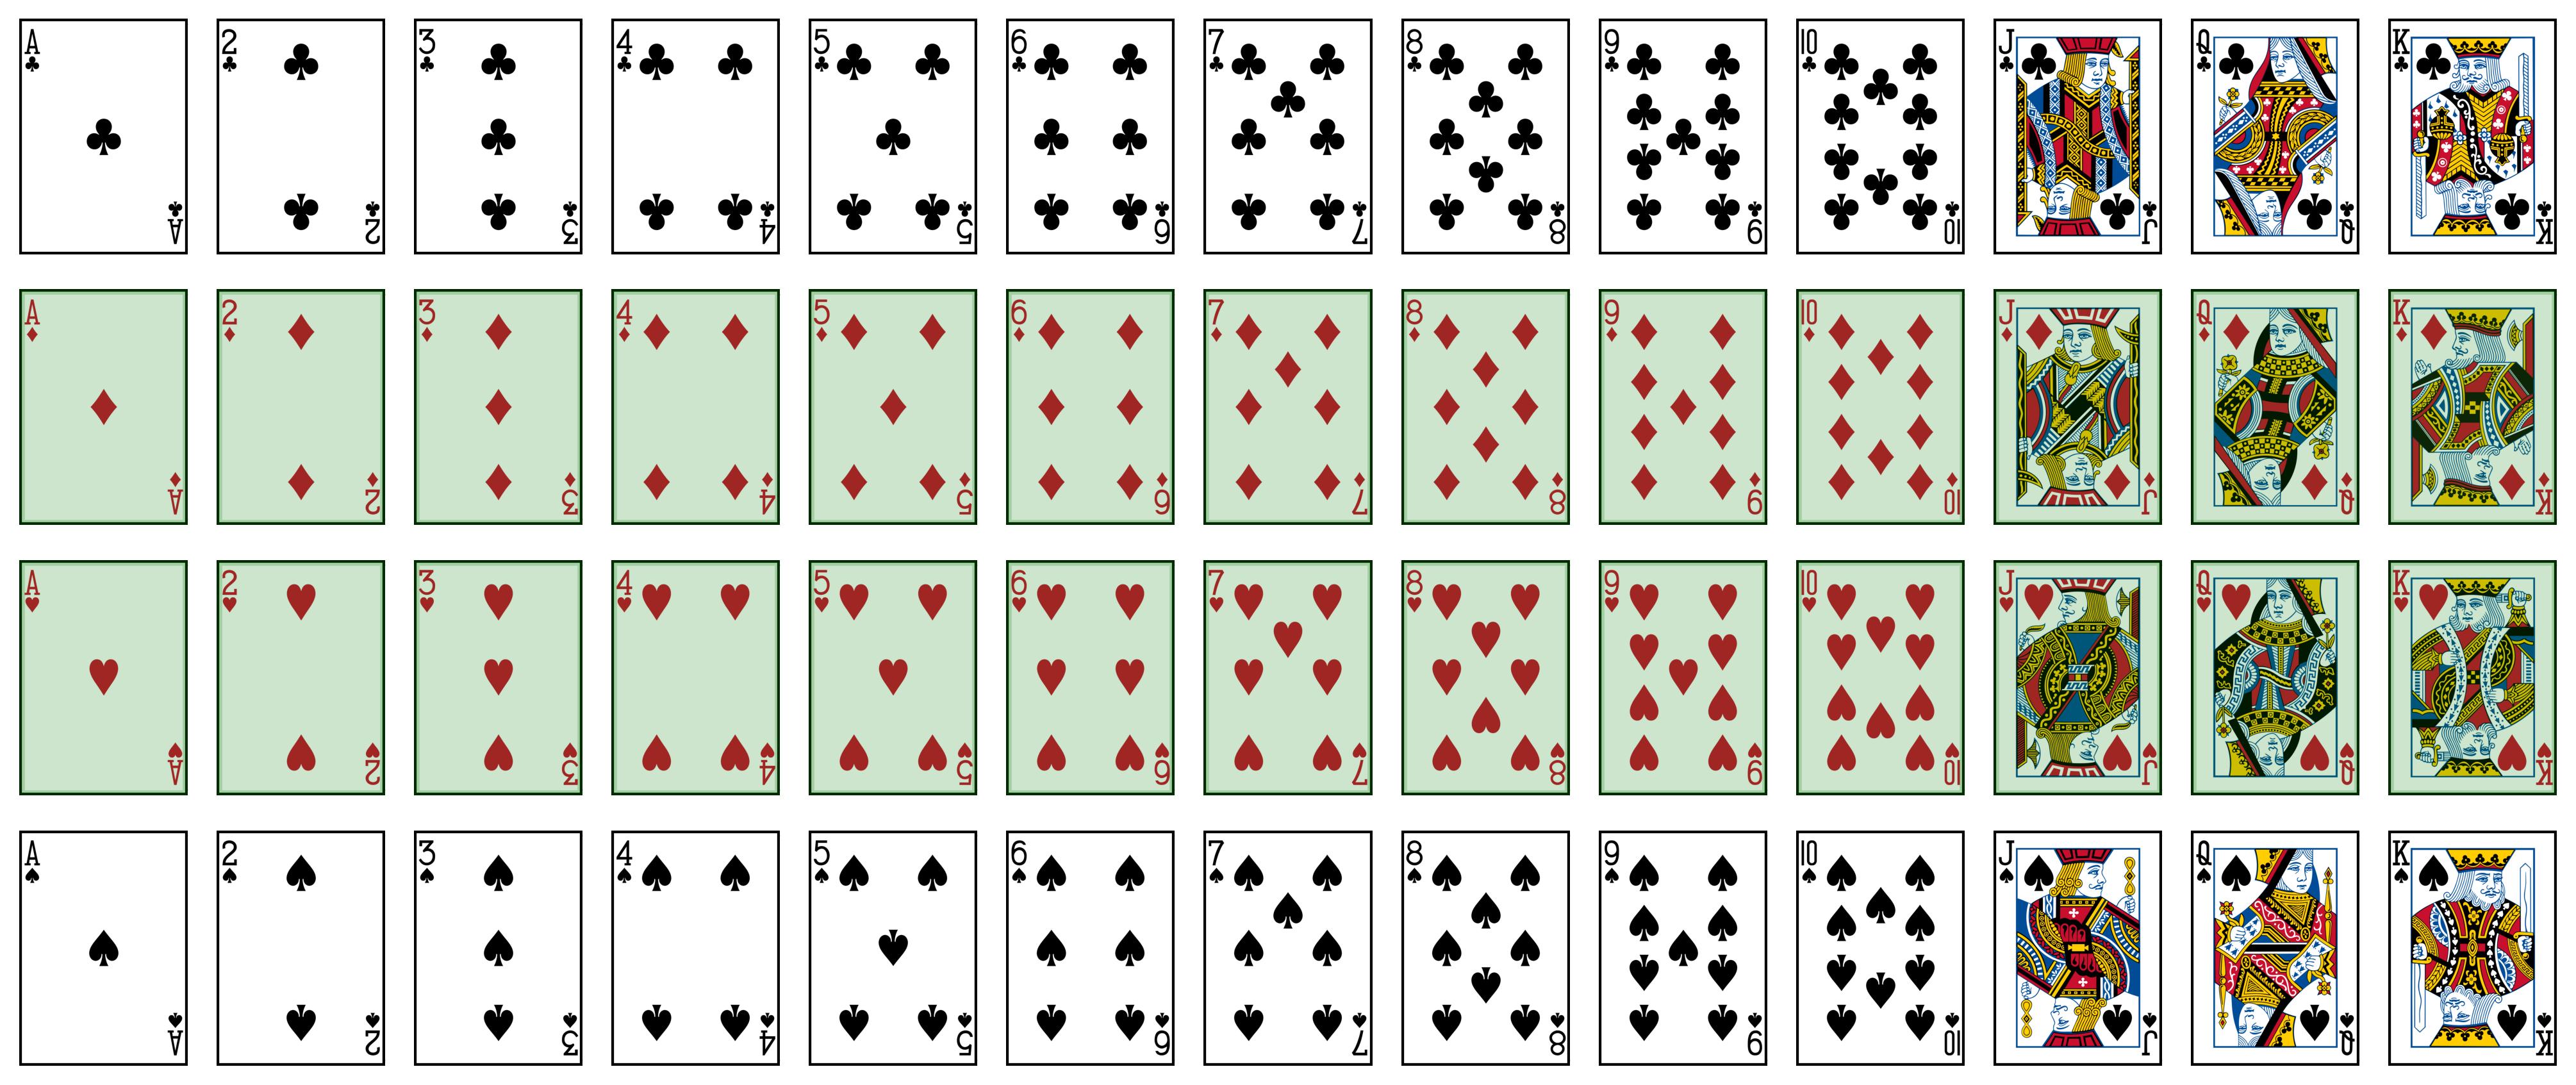
Fig. 3.26 Highlighted red cards in the deck.#
Since the Jacks of hearts and diamonds are included in both \( J \) and \( R \), we must subtract the overlap:
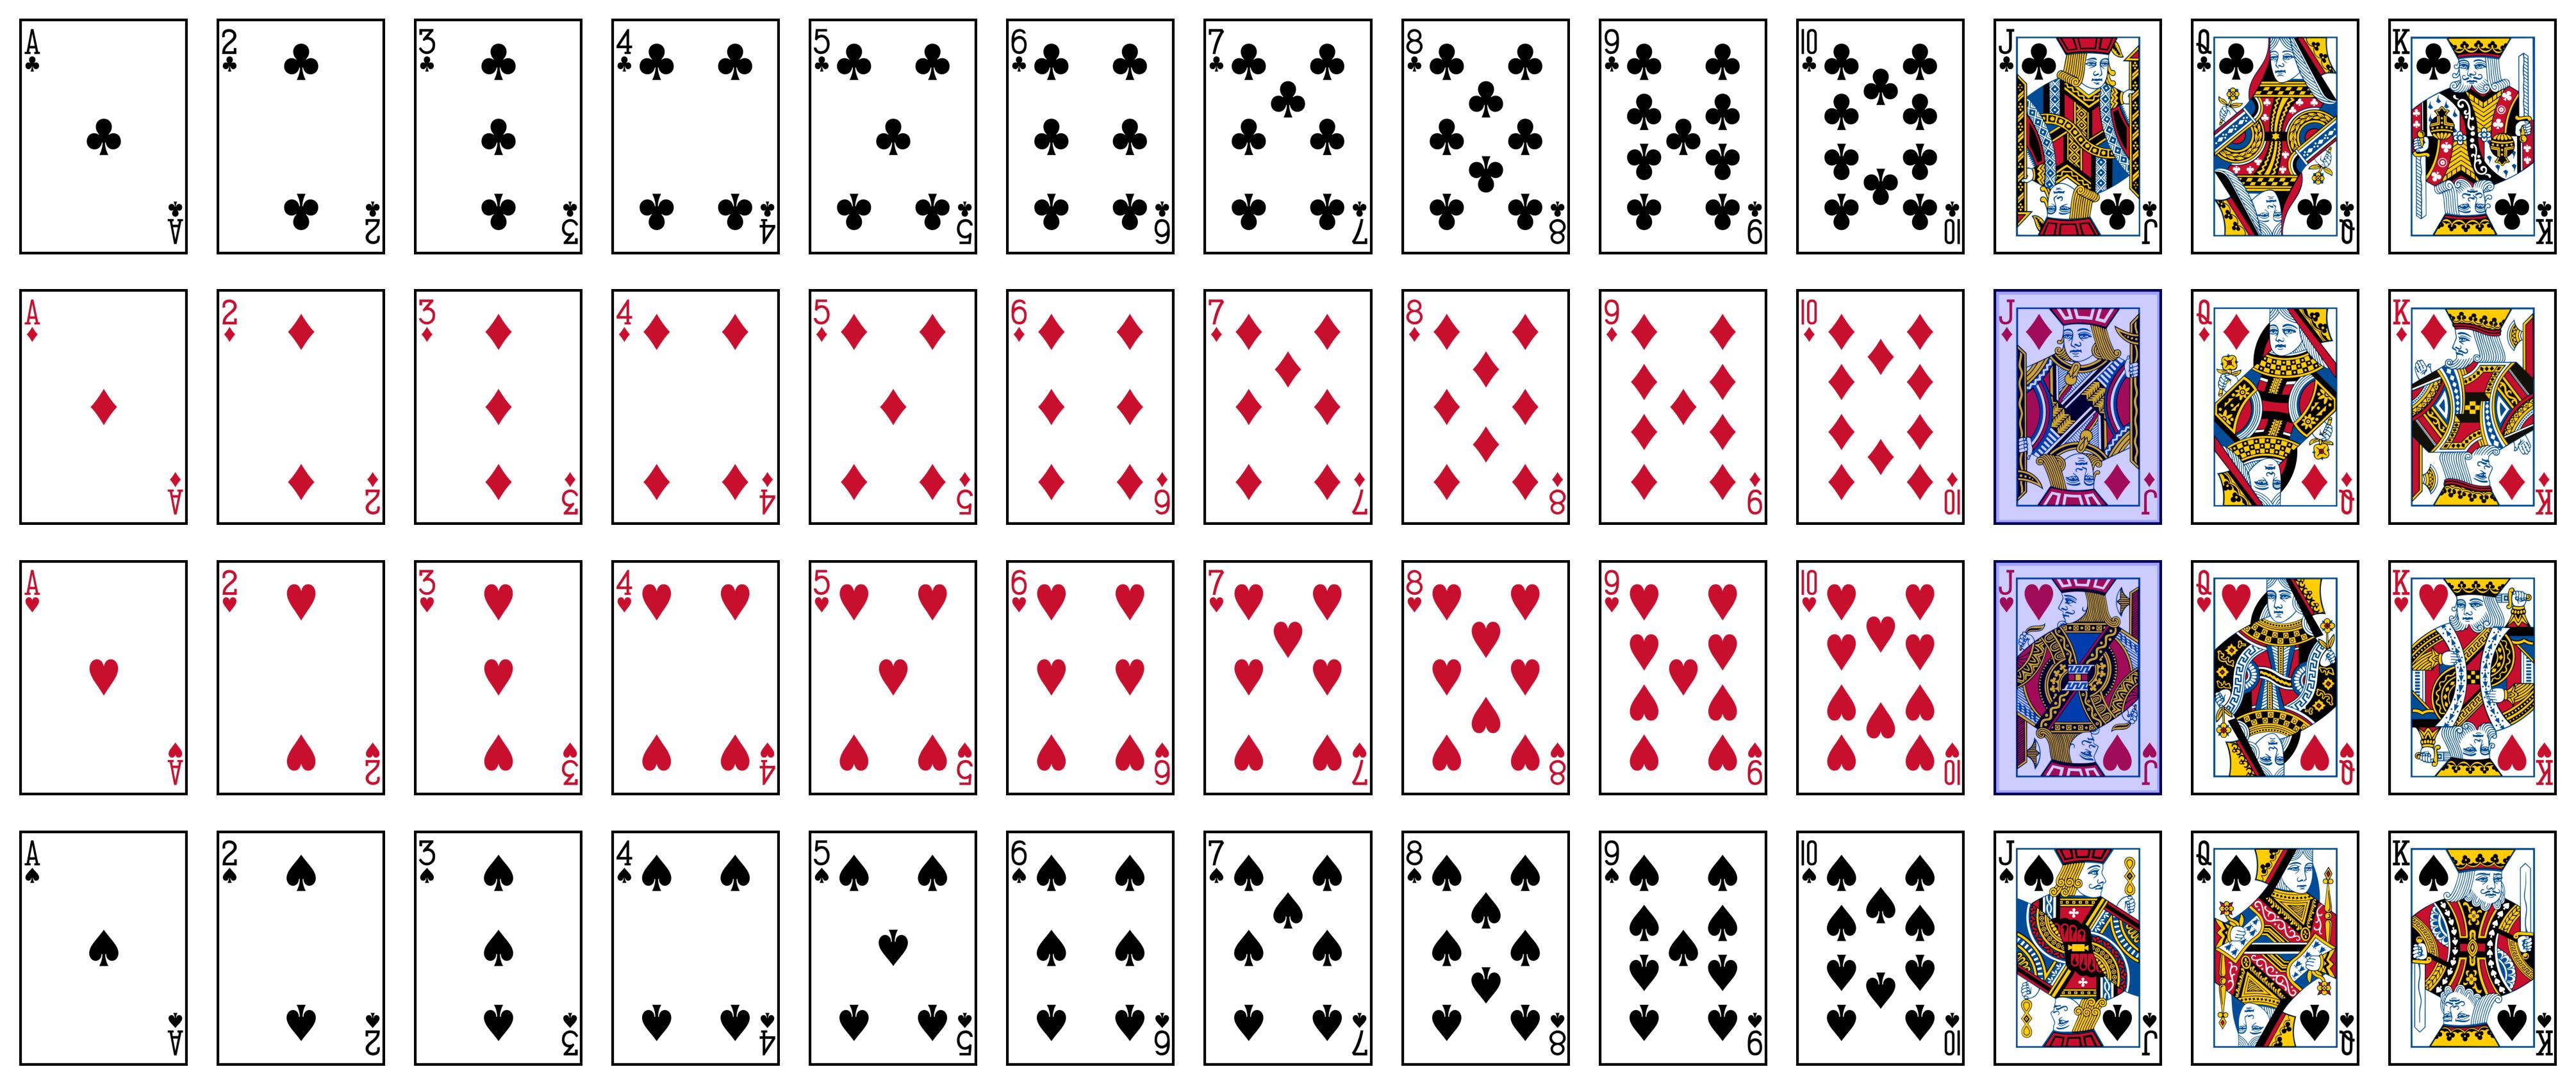
Fig. 3.27 Highlighted Jacks that are also red.#
Thus, the probability of drawing a Jack or a red card is:
b) Probability of Drawing a Card That Is Not a Heart:
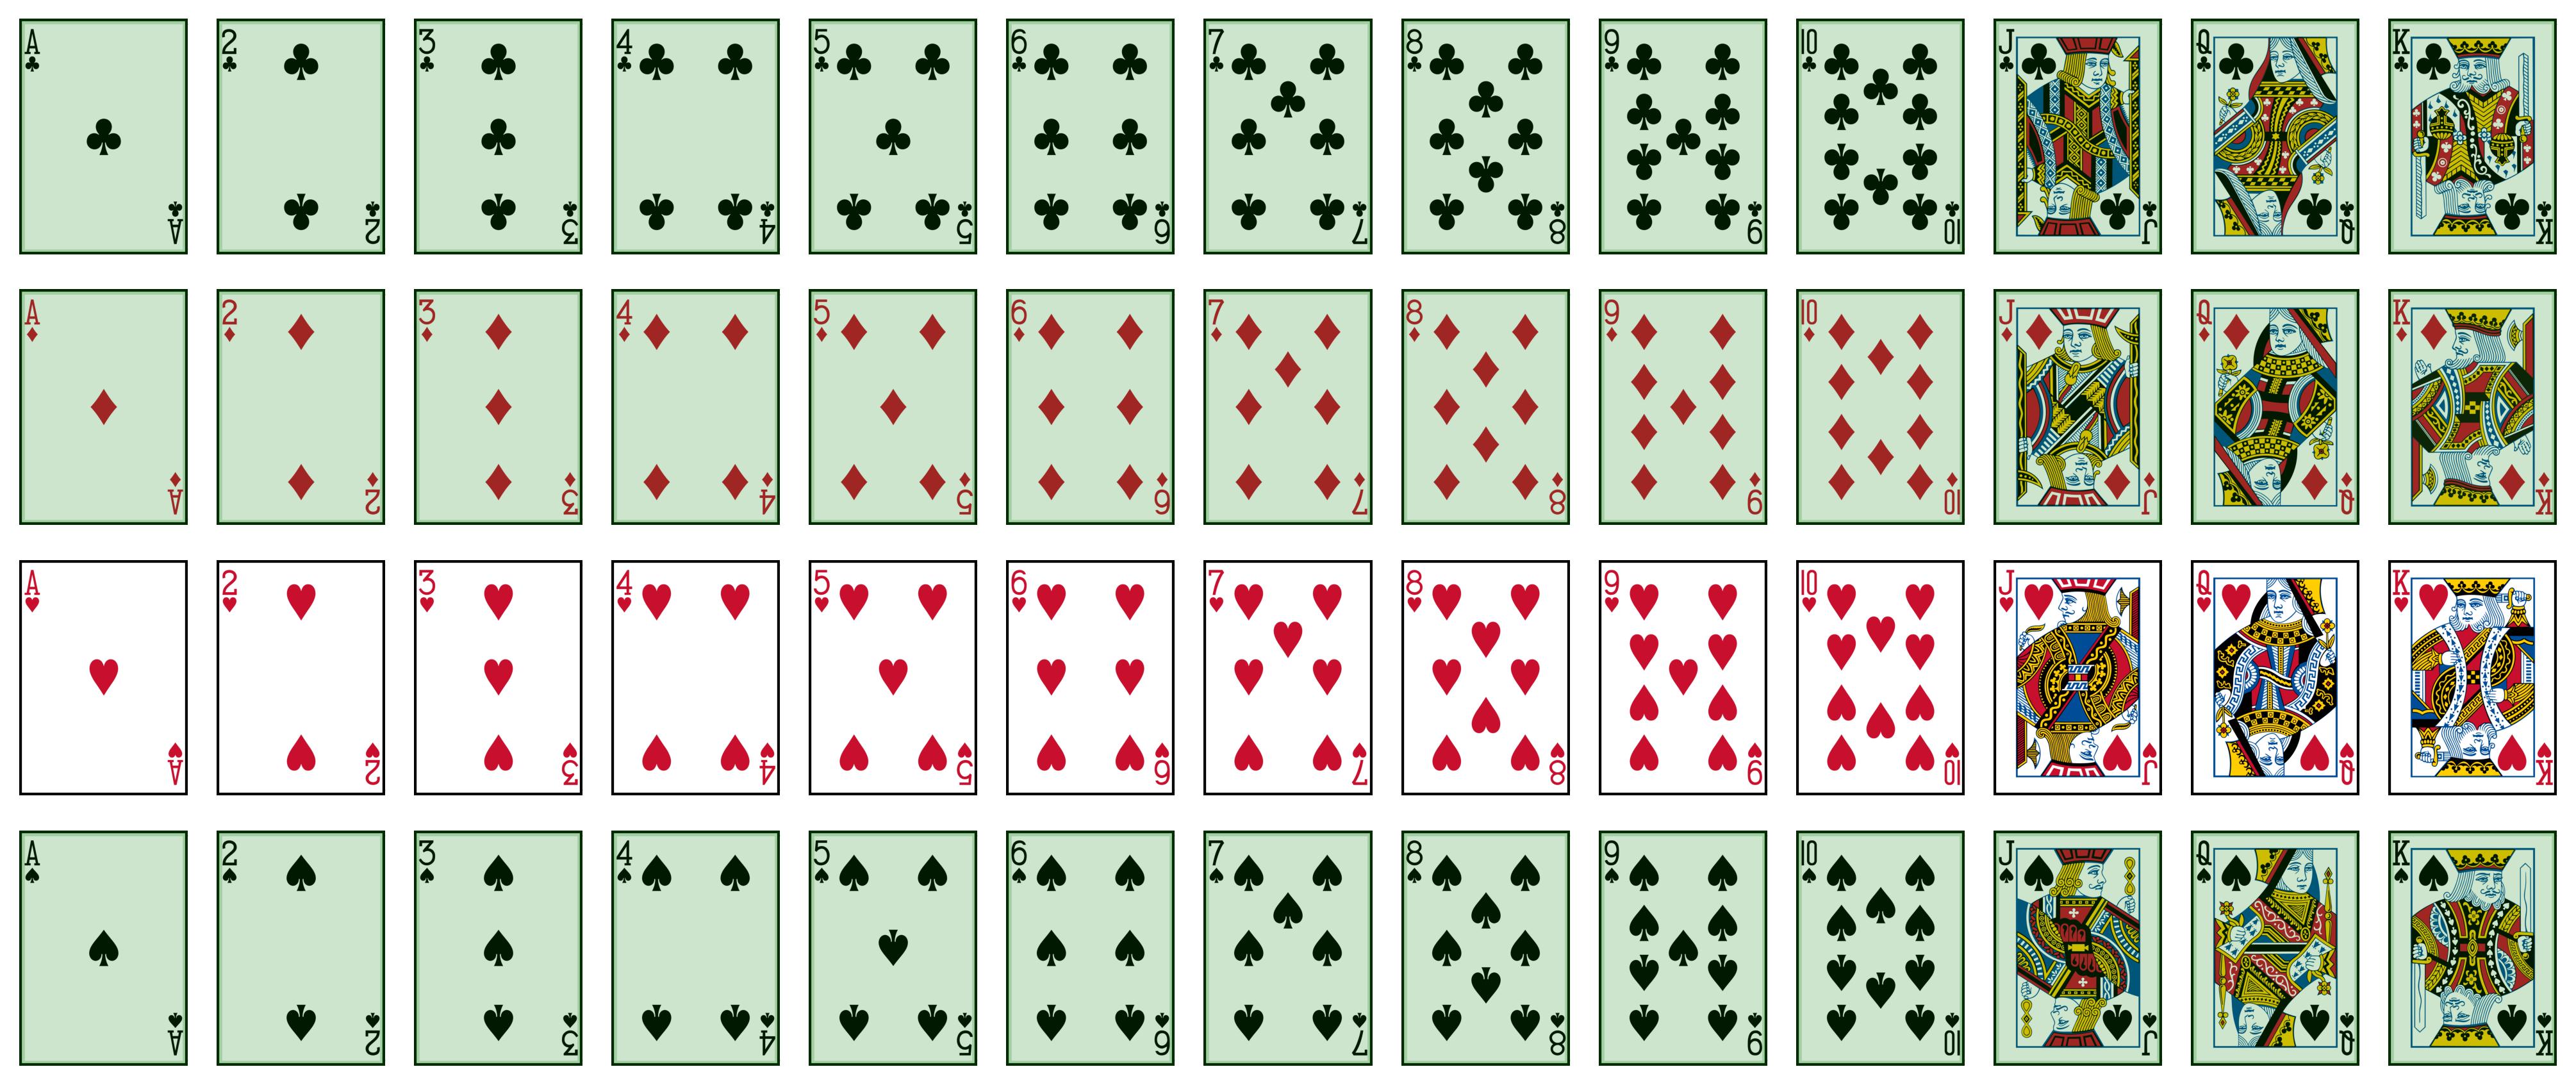
Fig. 3.28 Highlighted cards that are not hearts.#
Alternatively, we could do this in a more convenient way (which we will discuss later), and this approach would be suitable for you once we have covered that. Let \( H \) be the event of drawing a heart. The probability of not drawing a heart, denoted by \( H^c \), is:
There are 13 Heart cards:
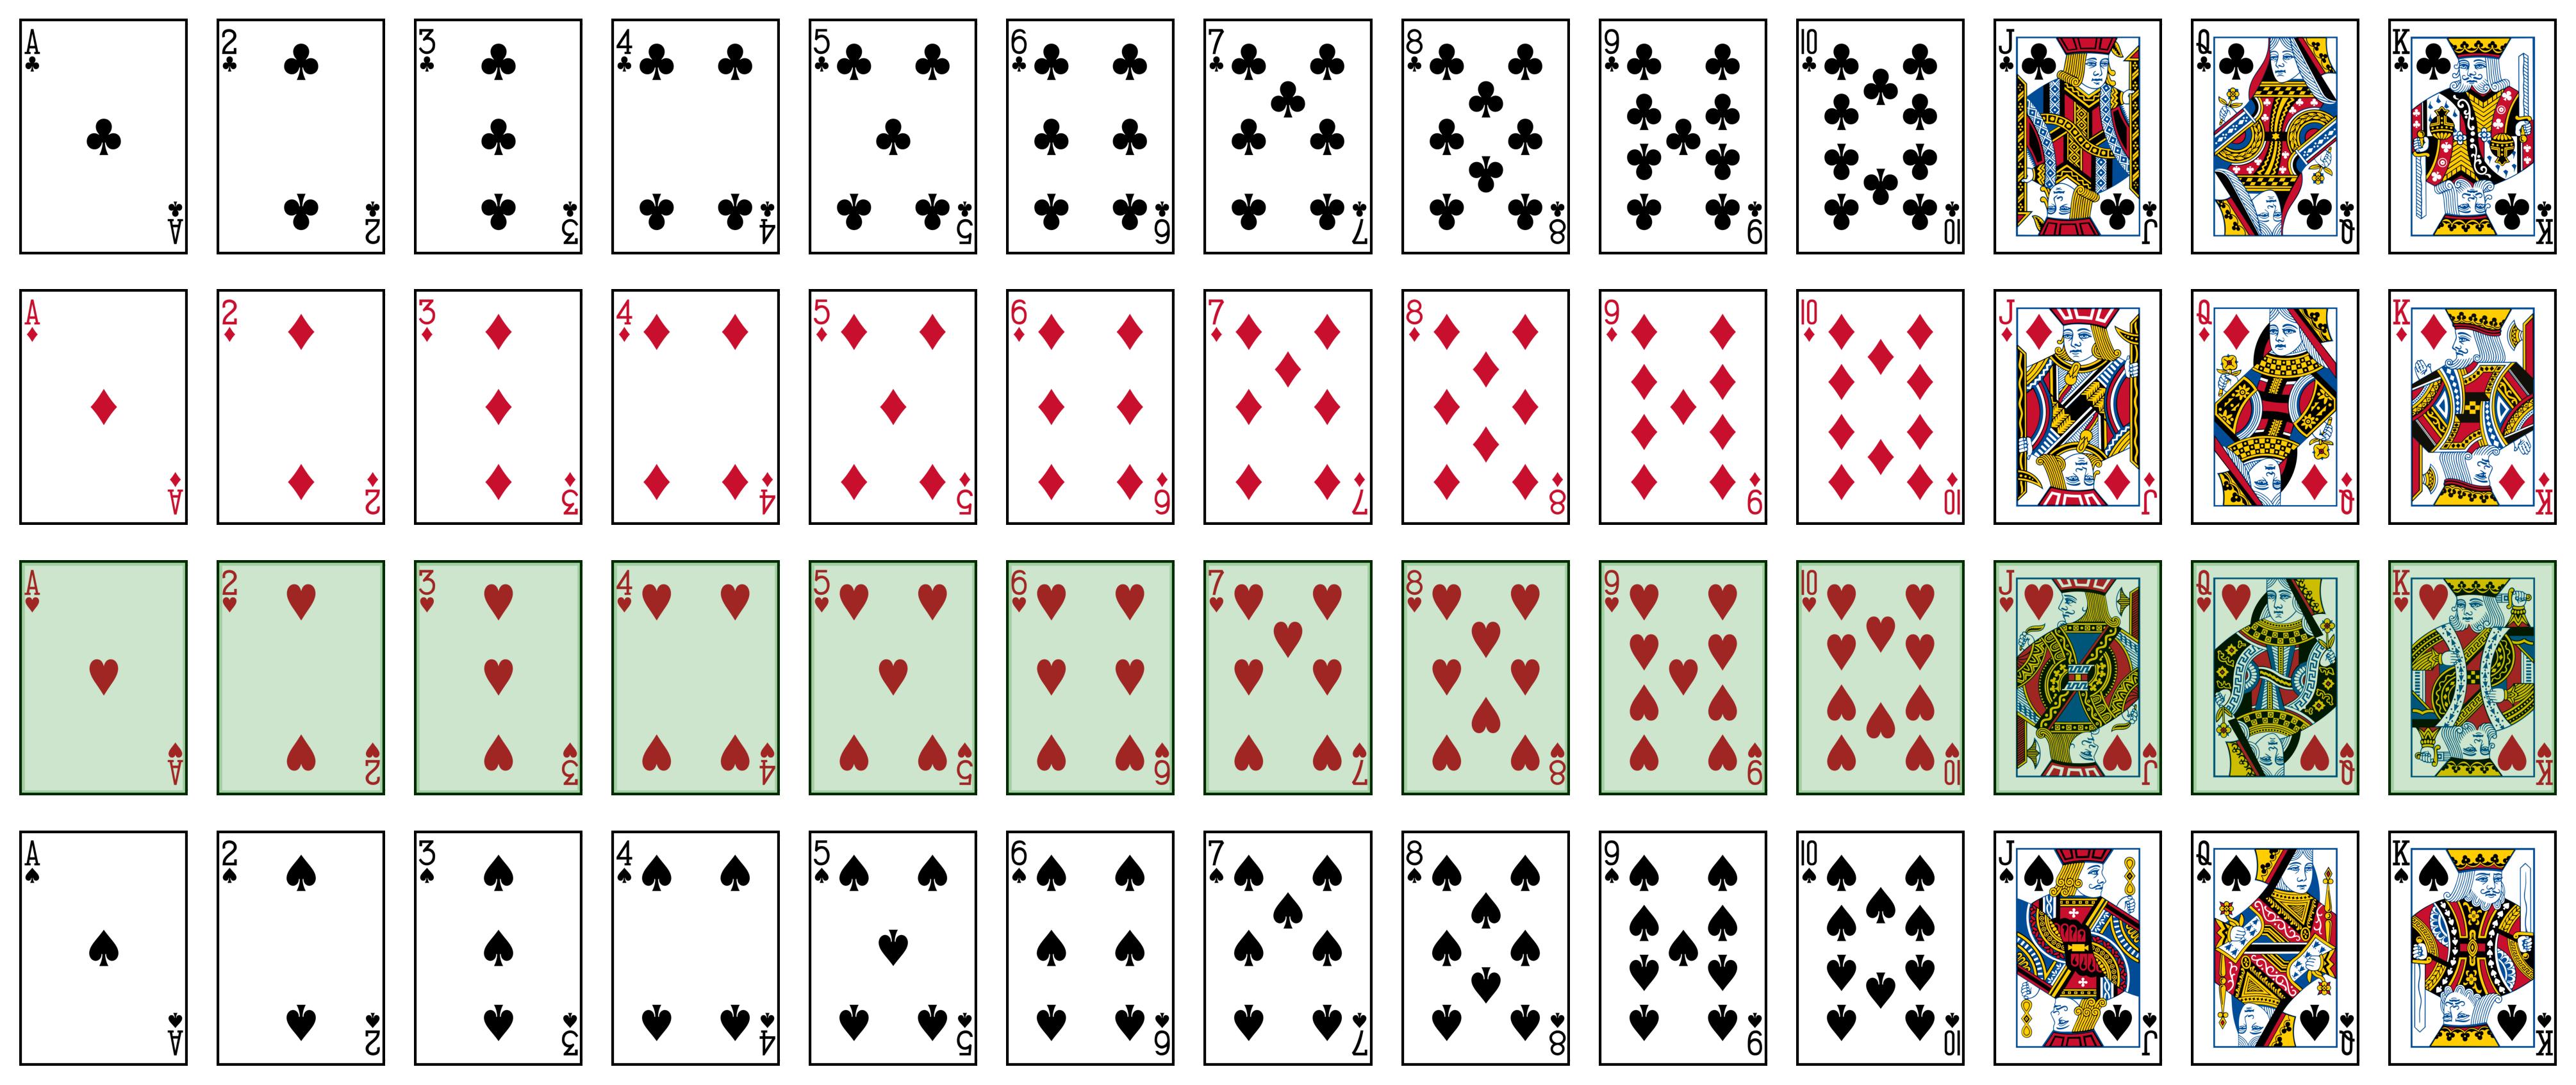
Fig. 3.29 Highlighted heart cards in the deck.#
and
c) Probability of Drawing a Spade or a Face Card: Let \( S \) be the event of drawing a spade and \( F \) be the event of drawing a face card. We have:
There are 13 Spade cards:
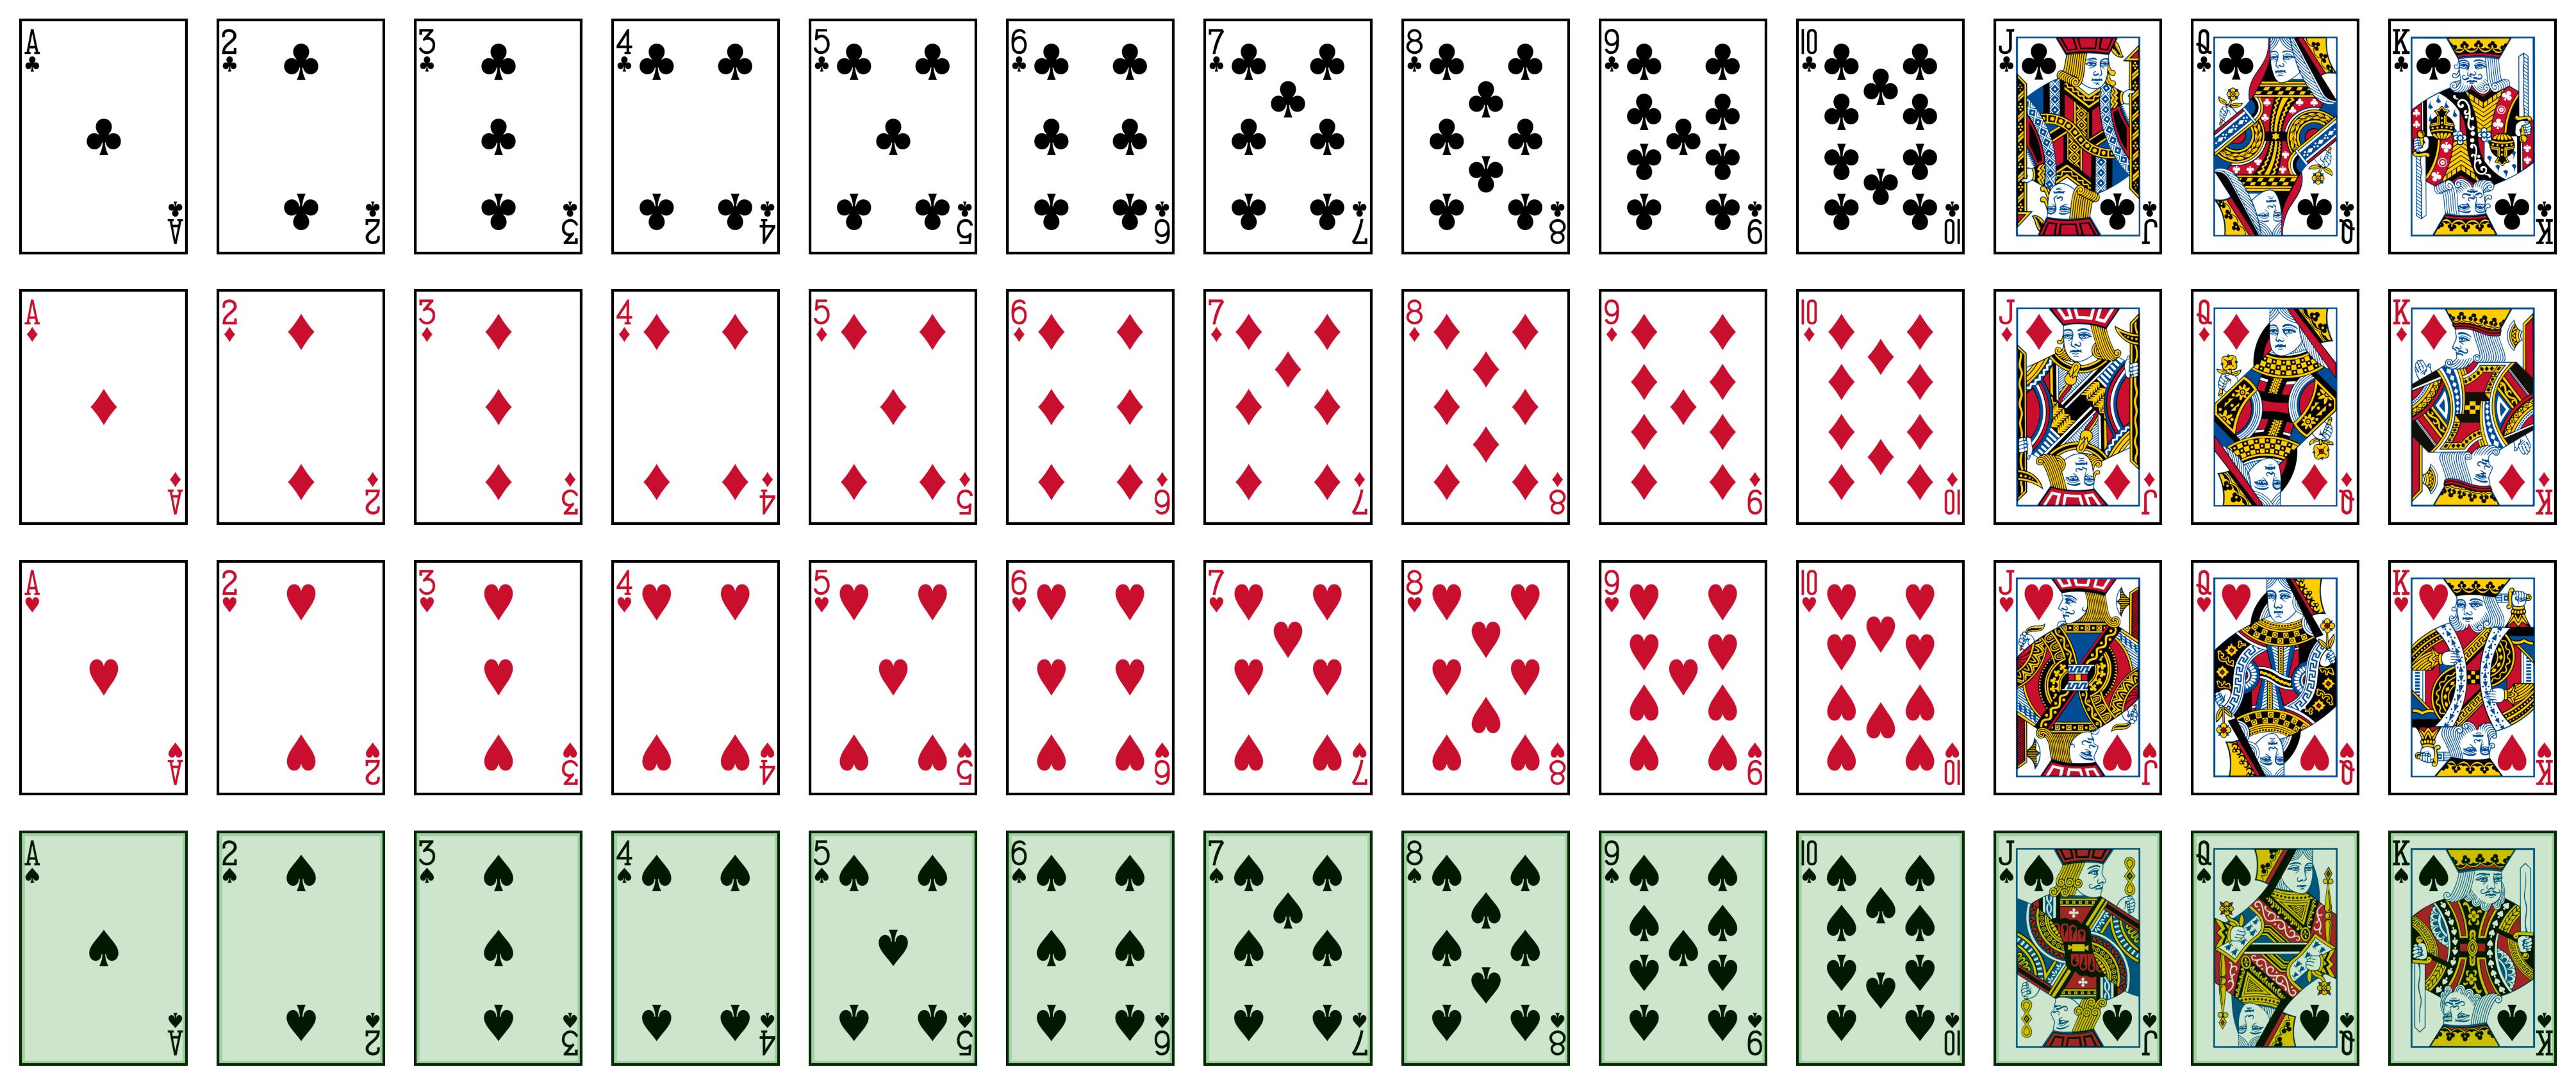
Fig. 3.30 Highlighted spade cards in the deck.#
There are 12 face cards:
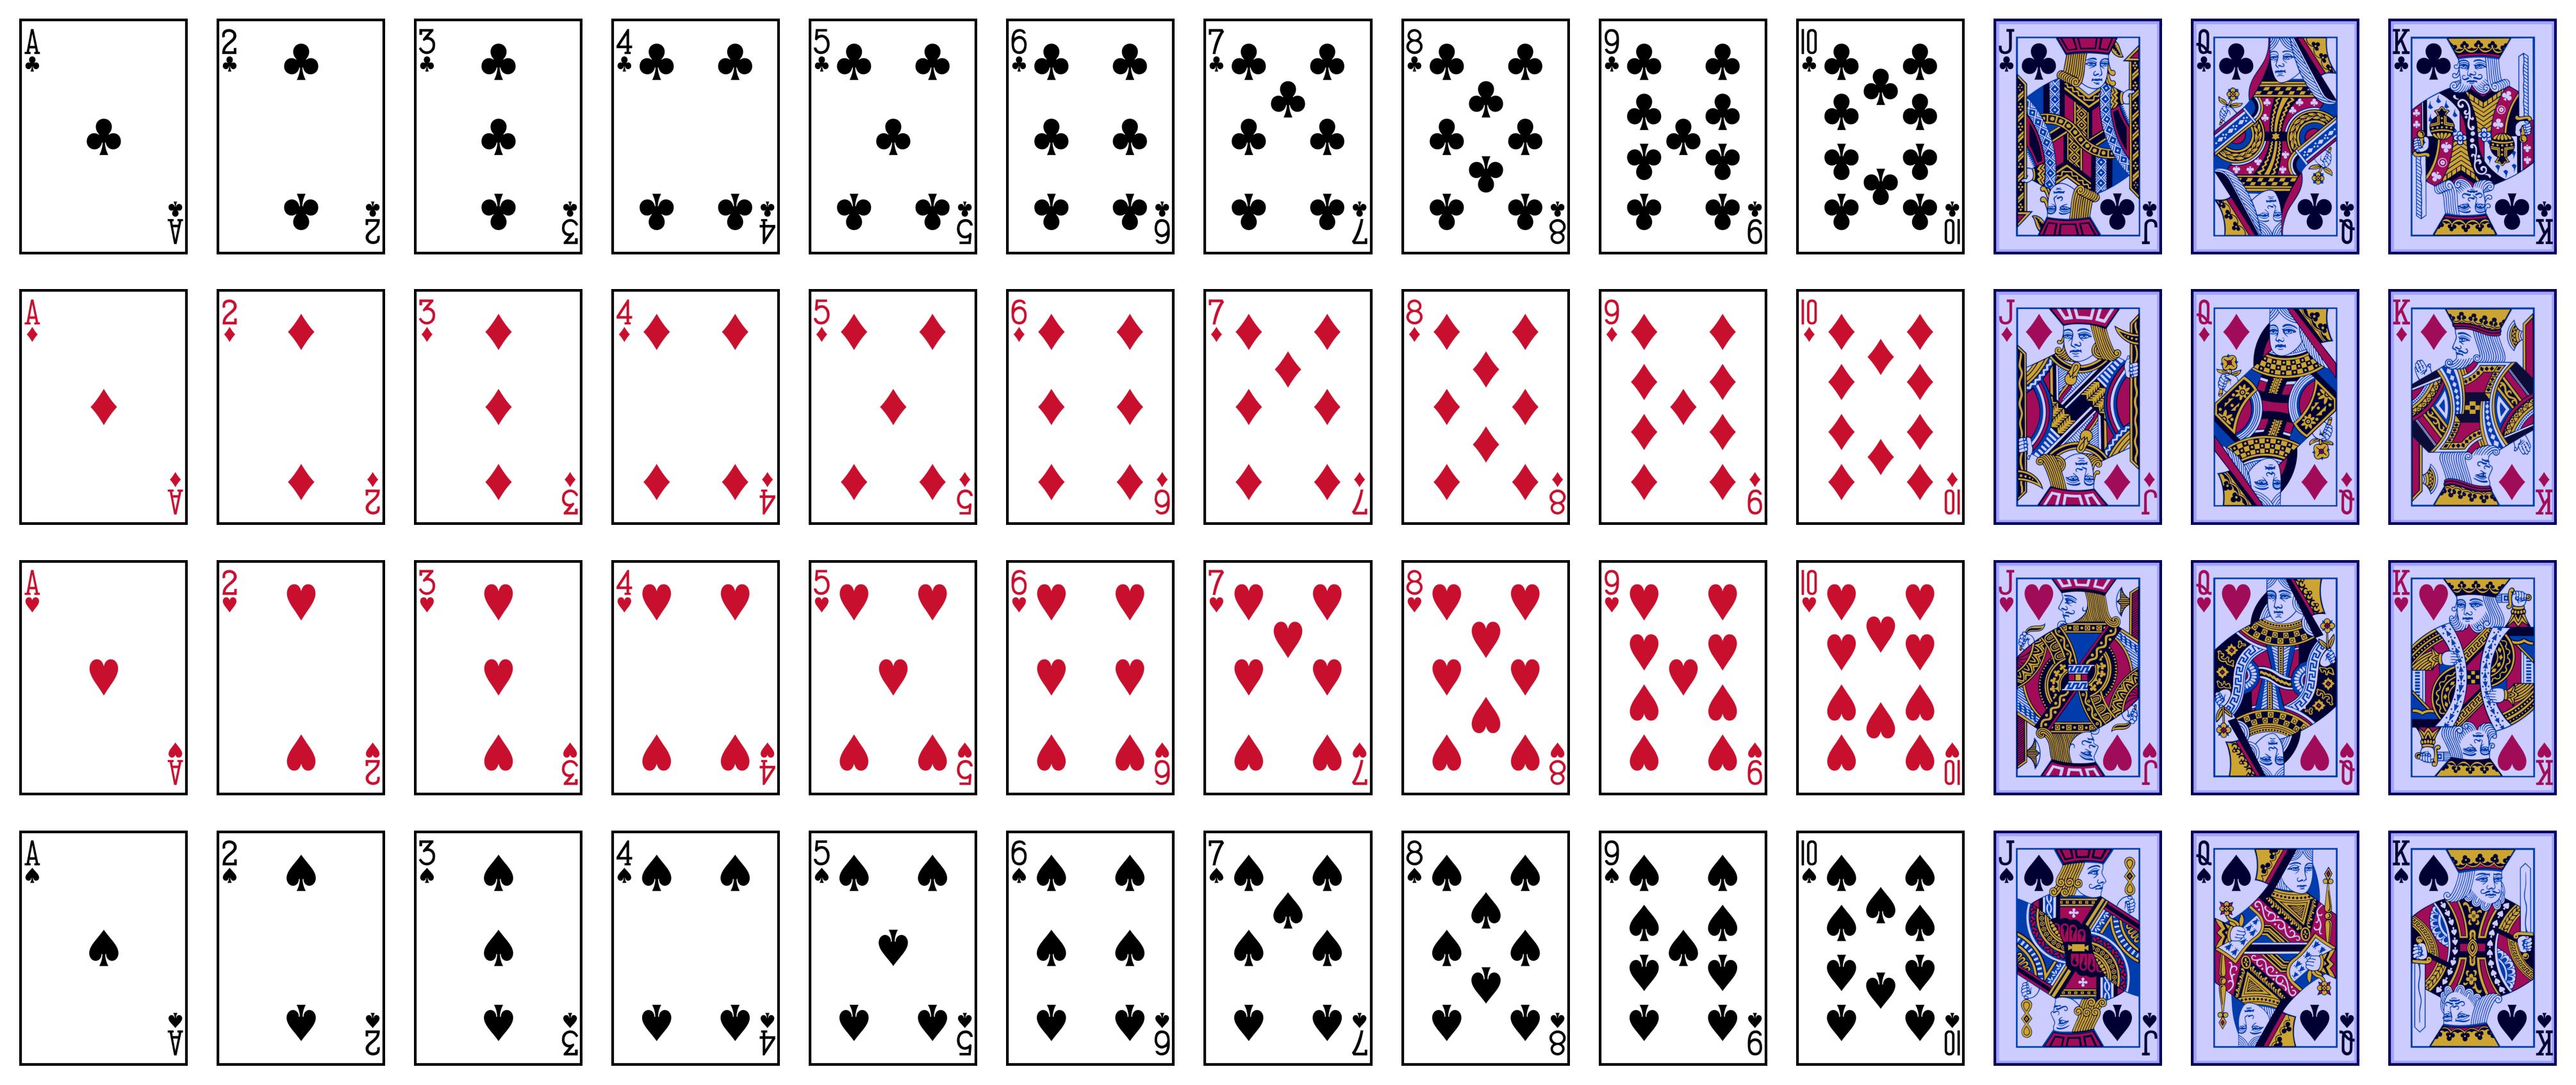
Fig. 3.31 Highlighted face cards in the deck.#
Since the King, Queen, and Jack of spades are included in both \( S \) and \( F \), we must subtract the overlap:
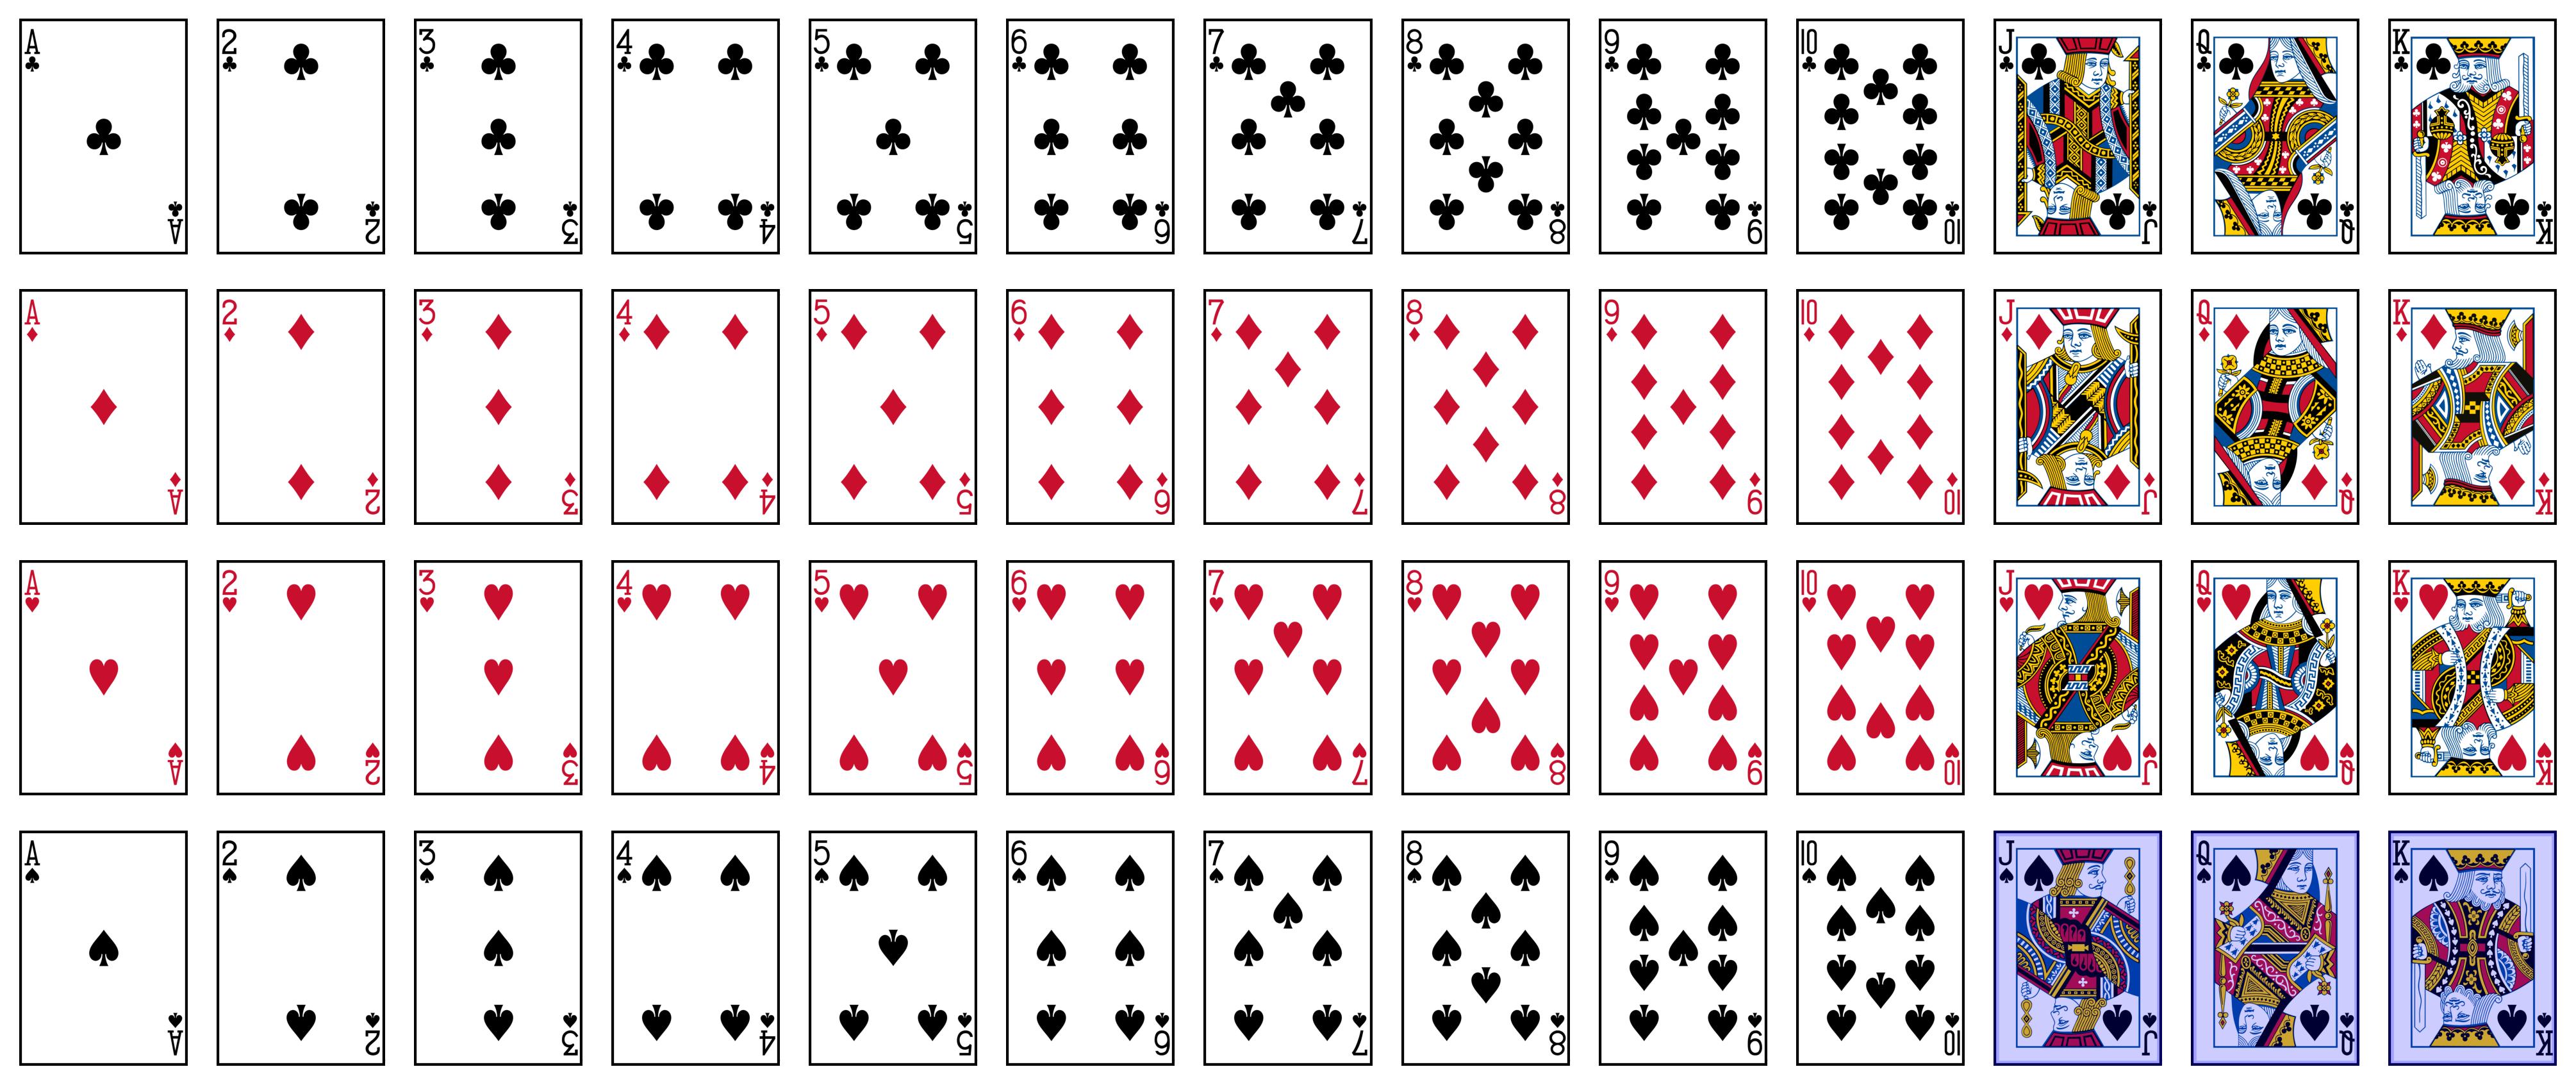
Fig. 3.32 Highlighted face cards that are also spades.#
Thus, the probability of drawing a spade or a face card is:
Example 3.17 (Probability with a Deck of Cards)
Consider a standard deck of 52 playing cards, which consists of four suits: hearts, diamonds, clubs, and spades. Each suit contains 13 cards, including numbered cards from 2 to 10, an Ace, and the face cards: Jack, Queen, and King.
Tasks:
a) What is the probability of drawing an Ace or a Club?
b) What is the probability of drawing a Queen or a Diamond card?
c) What is the probability of drawing a card that is either a number 2 or a black card?

Fig. 3.33 A standard deck of playing cards. Image generated based on this source.#
Solution:
a) Probability of Drawing an Ace or a Club:
Let \( A \) be the event of drawing an Ace and \( C \) be the event of drawing a Club. We have:
There are 4 Ace cards:
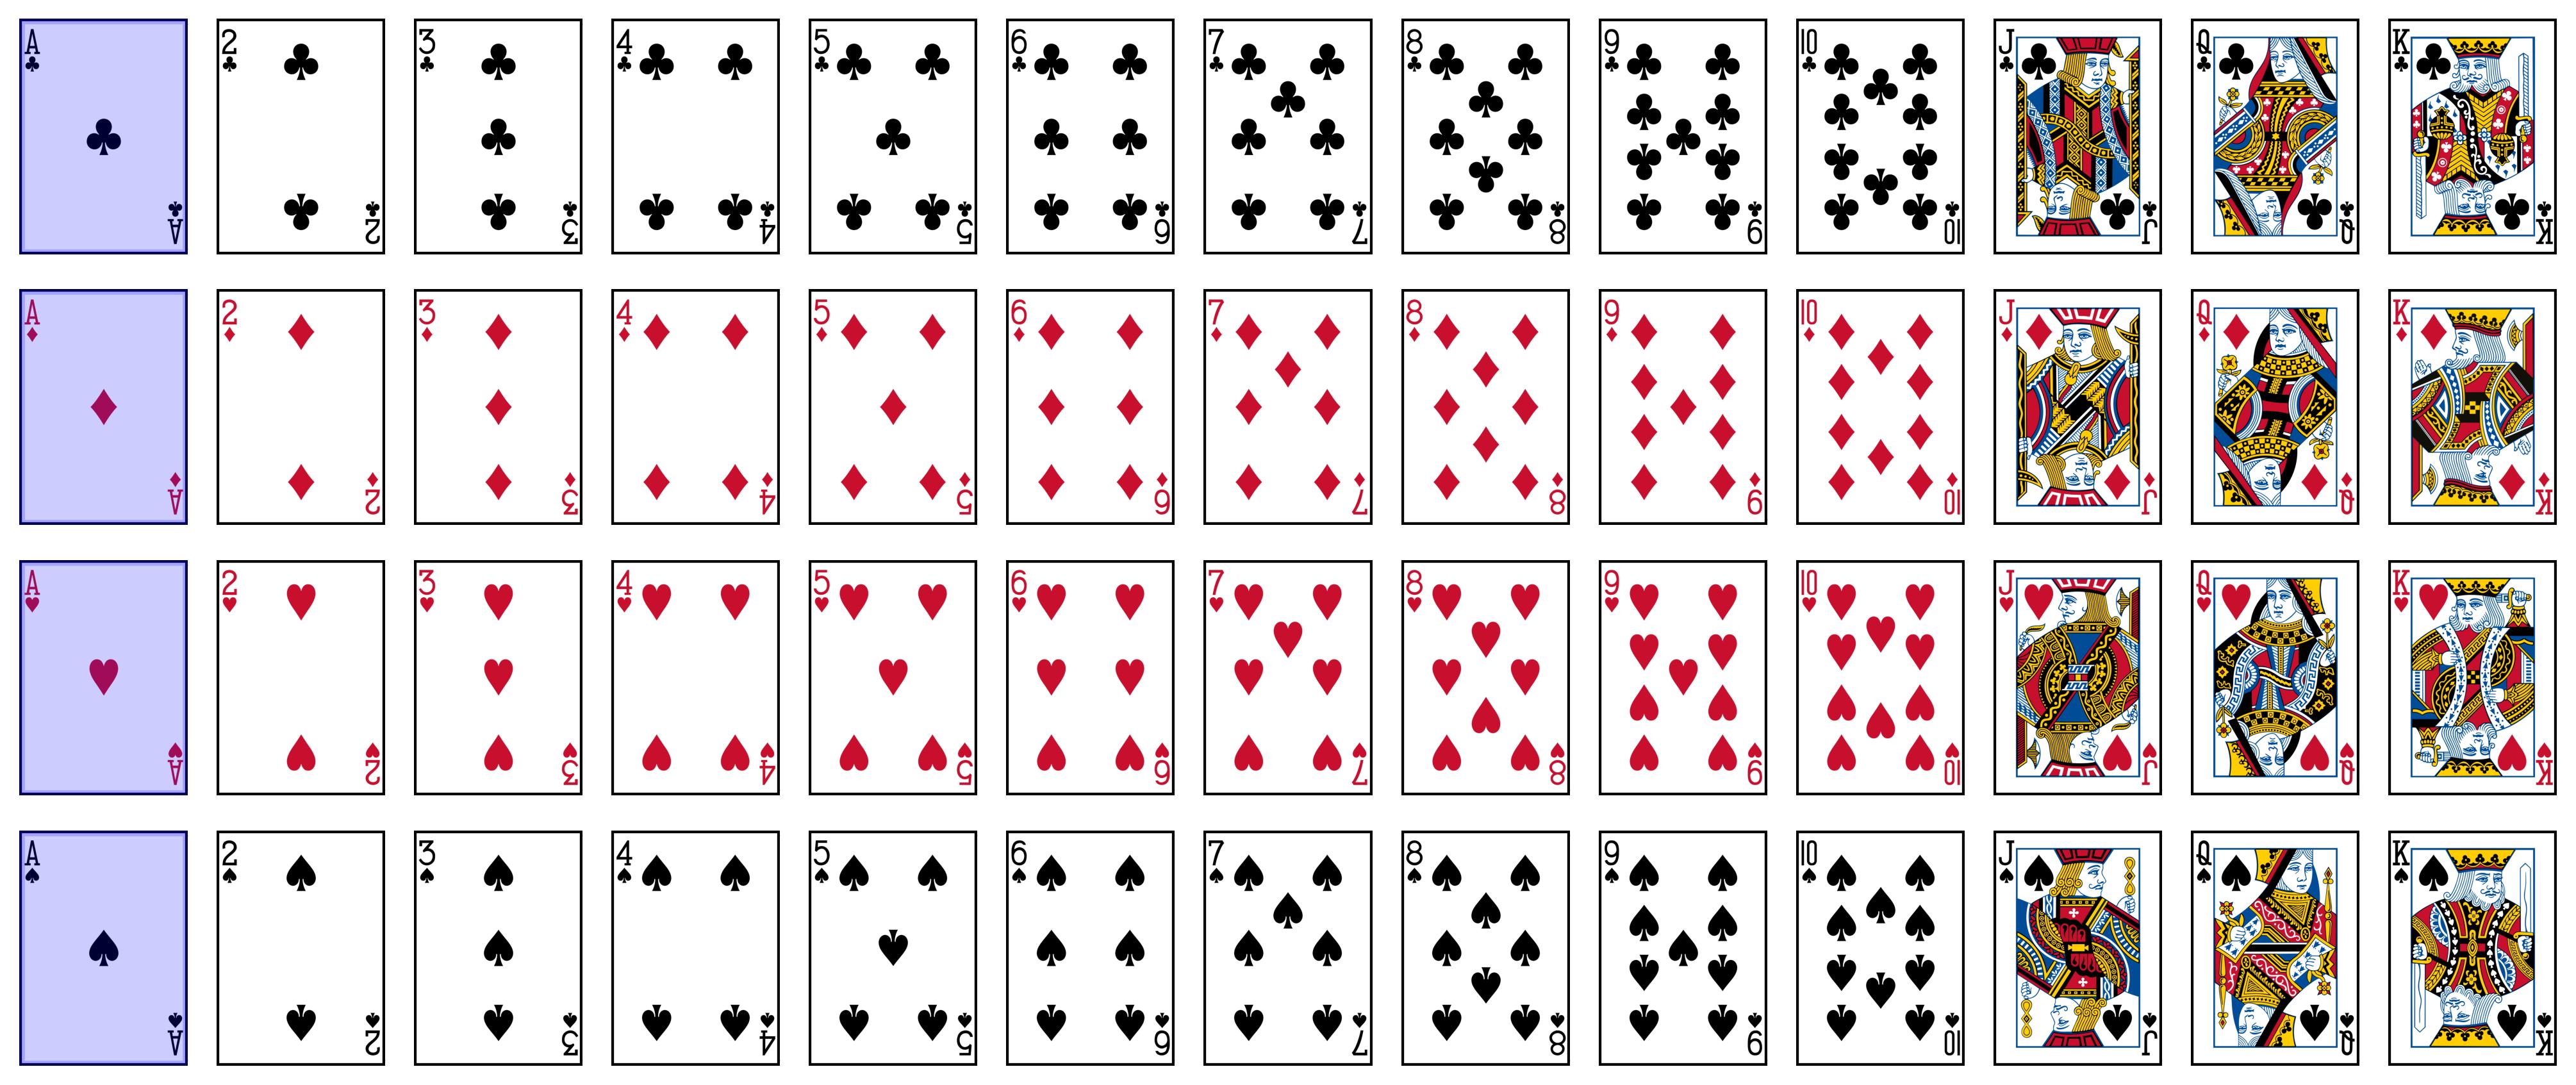
Fig. 3.34 Highlighted Ace cards in the deck.#
There are 13 Club cards:
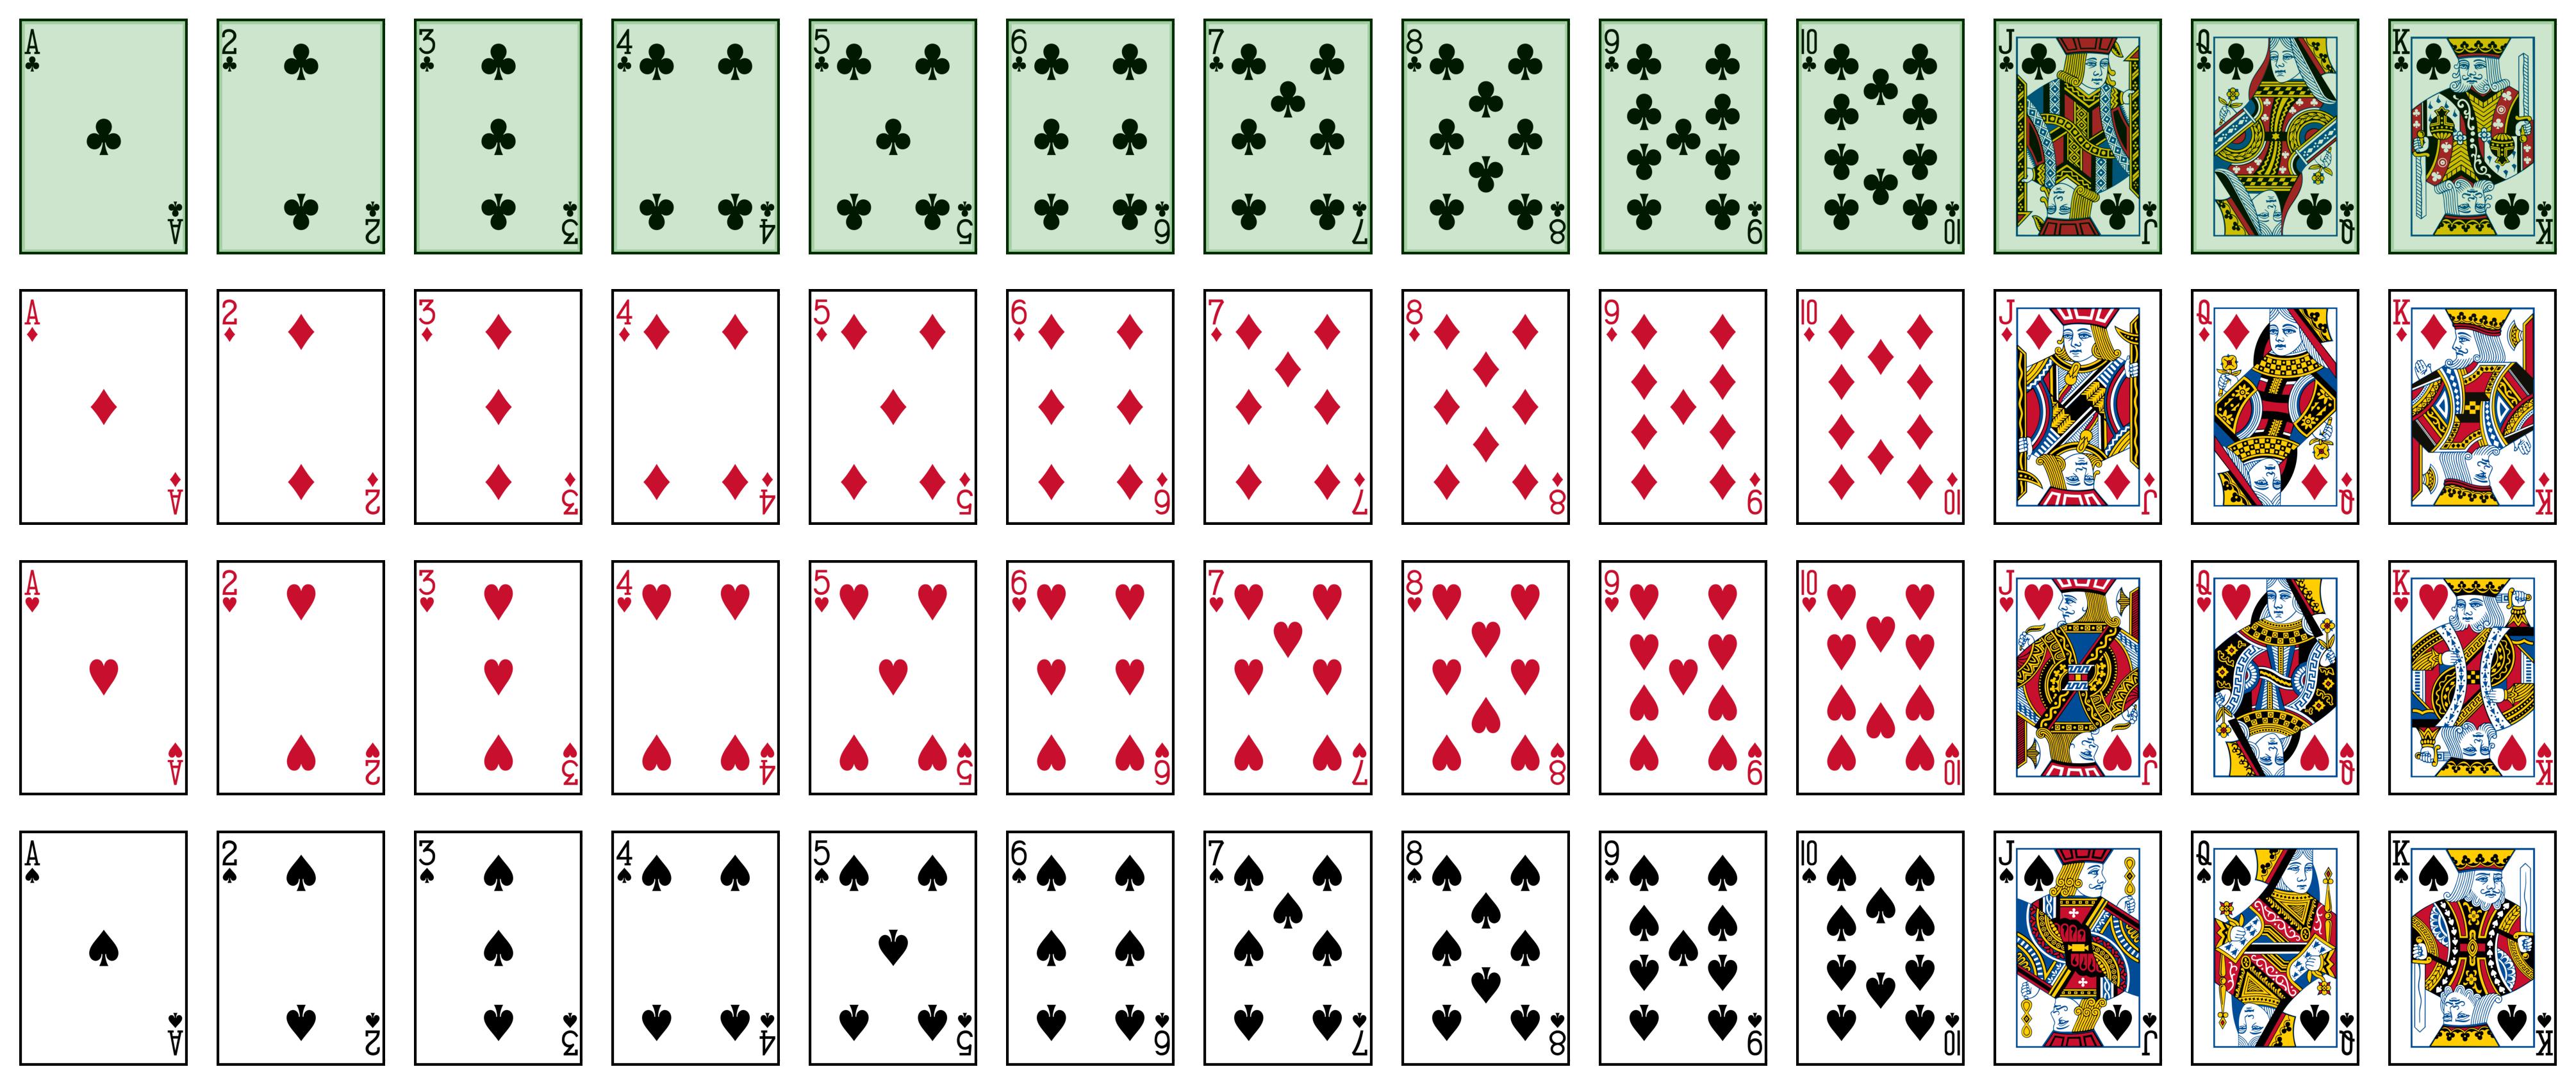
Fig. 3.35 Highlighted Club cards in the deck.#
Since the Ace of clubs is counted in both \( A \) and \( C \), we must subtract the overlap:
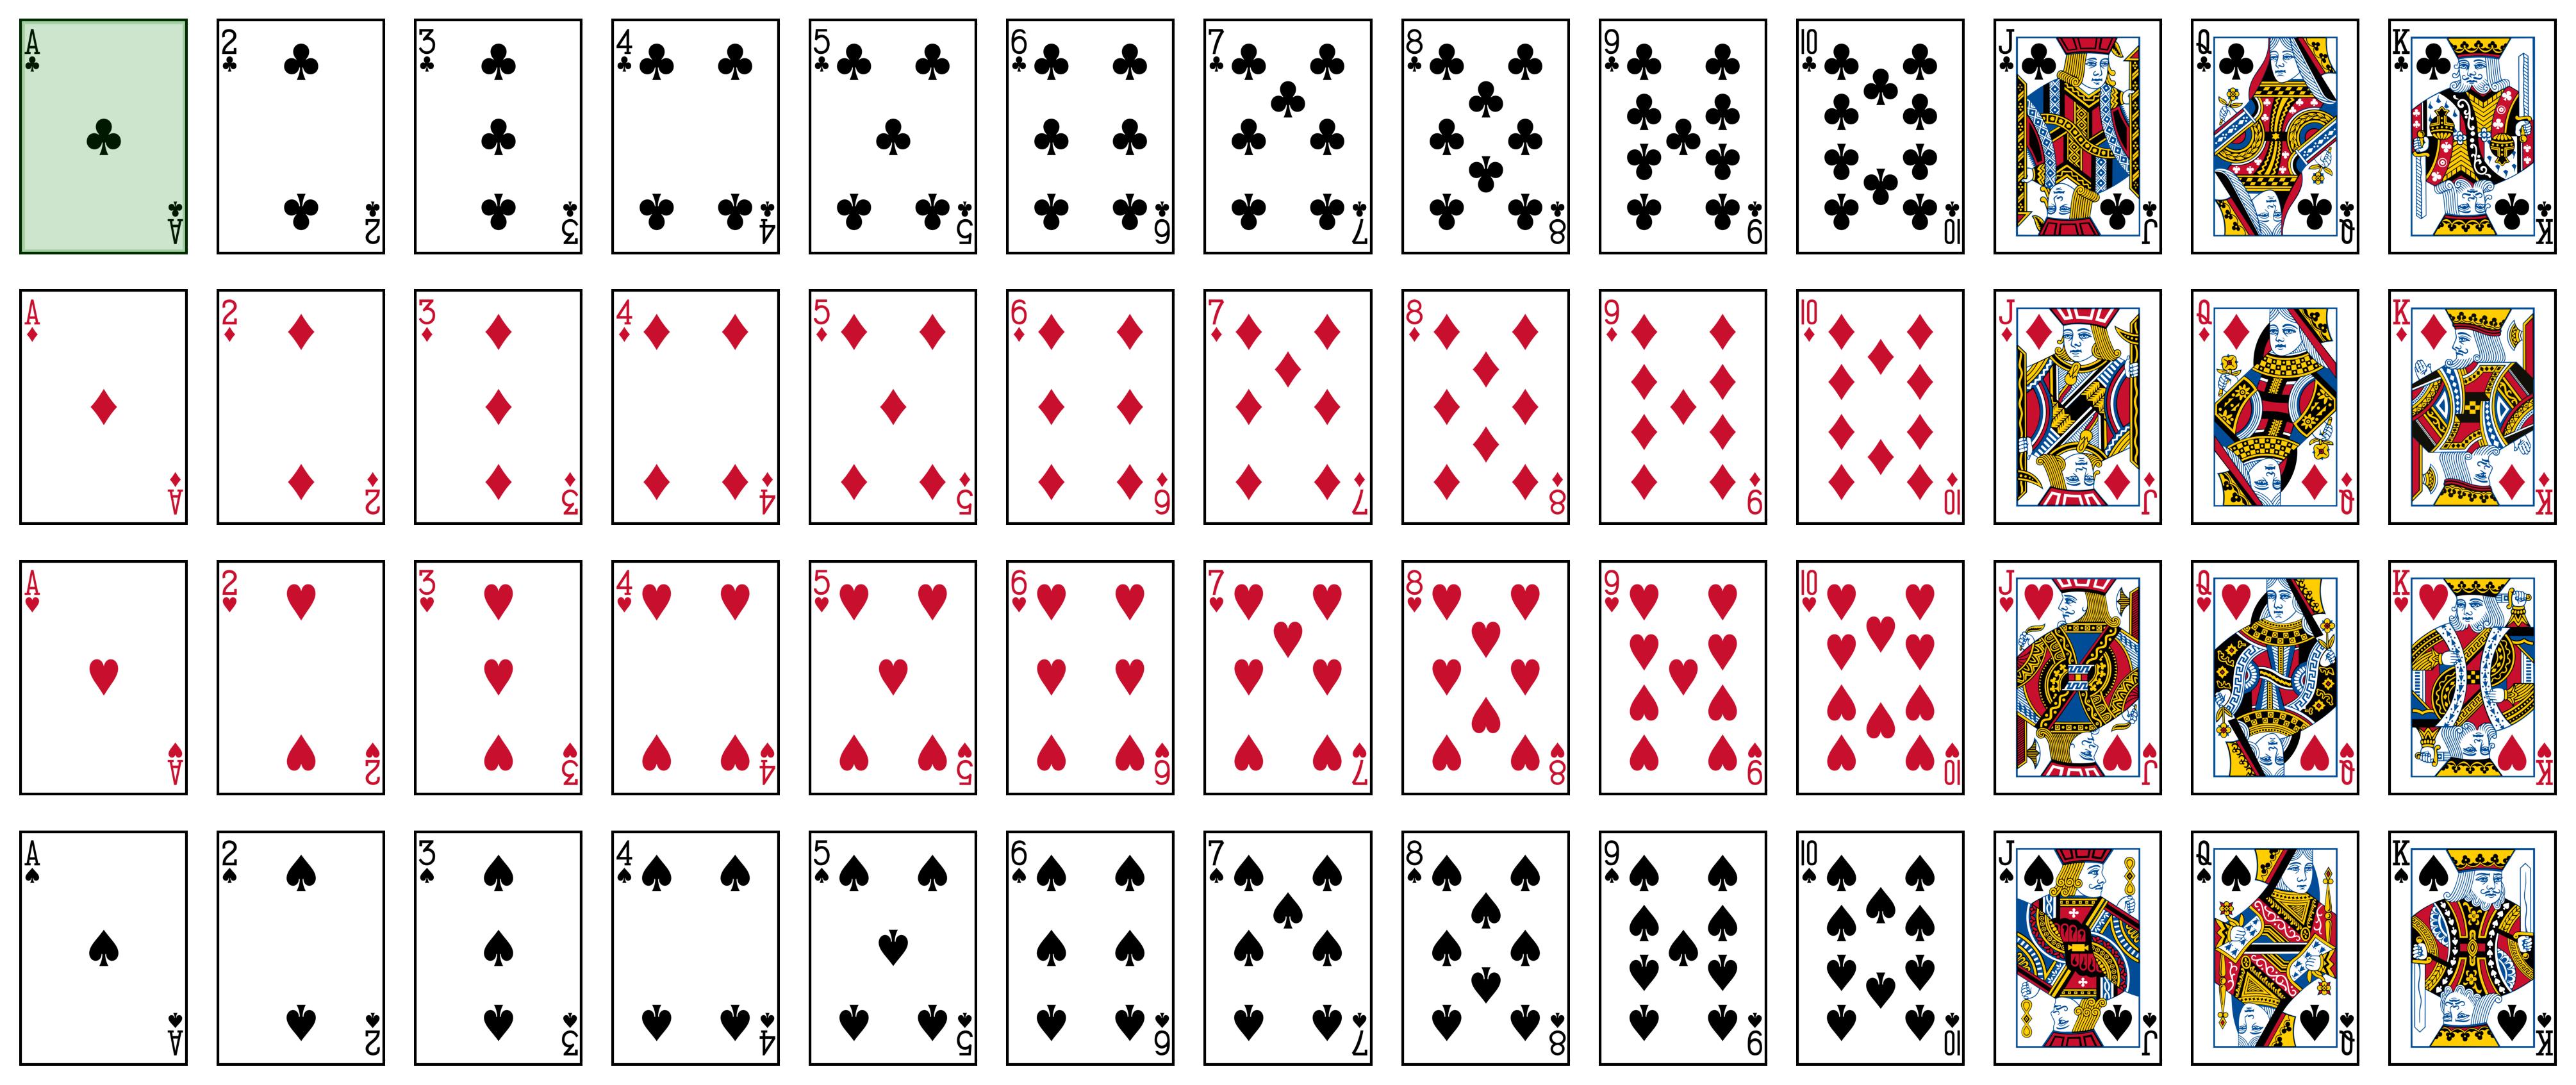
Fig. 3.36 Highlighted Ace of Clubs.#
Thus, the probability of drawing an Ace or a Club is:
b) Probability of Drawing a Queen or a Diamond Card: Let \( Q \) be the event of drawing a Queen and \( D \) be the event of drawing a Diamond. We have:
There are 4 Queen cards:
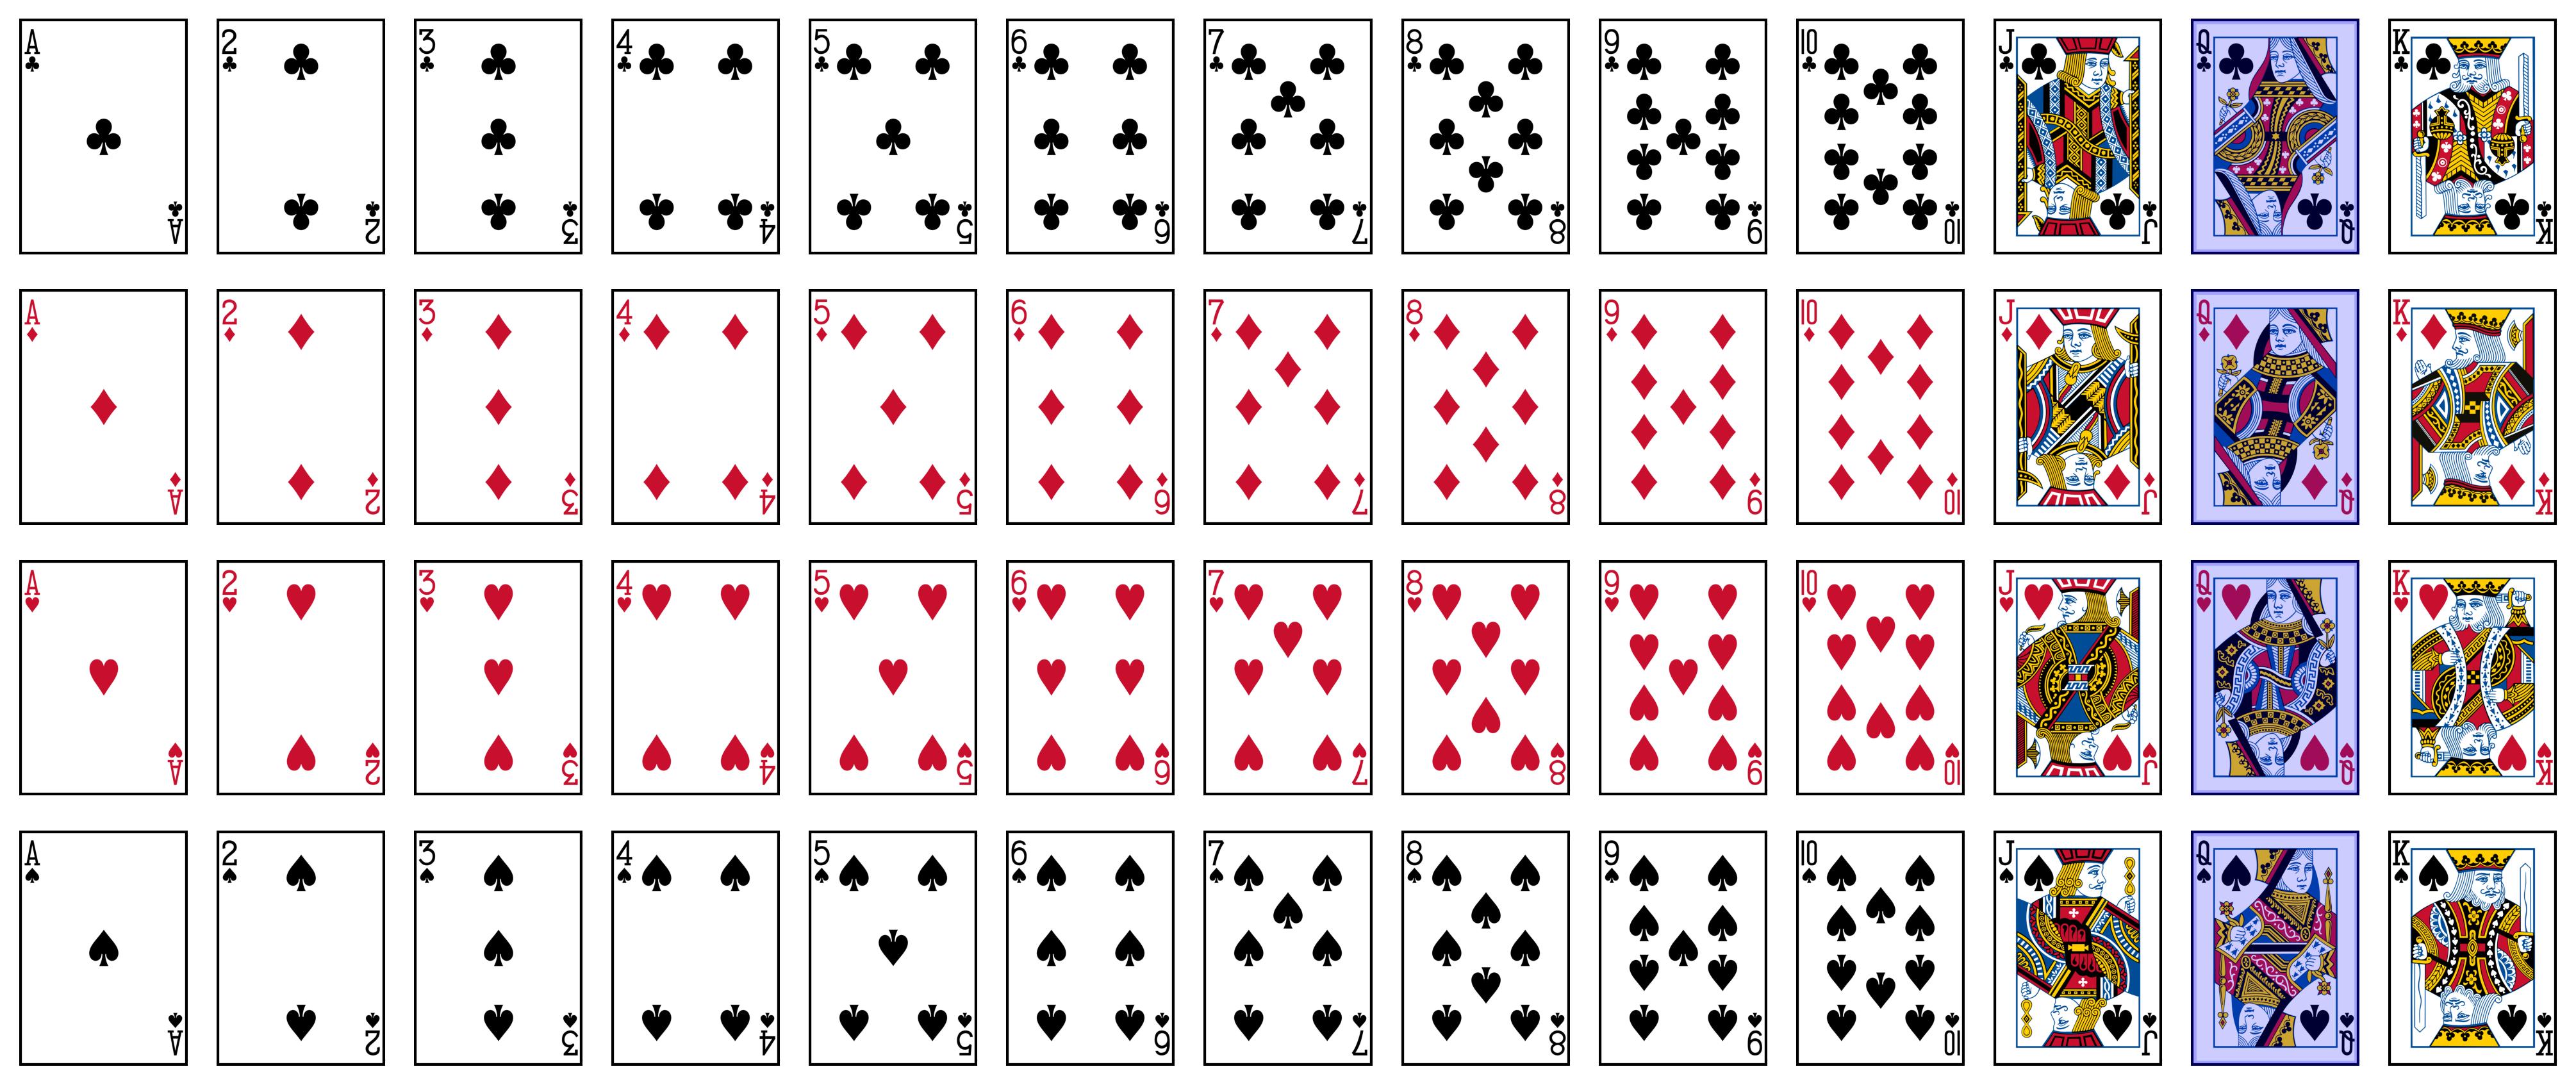
Fig. 3.37 Highlighted Queen cards in the deck.#
There are 13 Diamond cards:
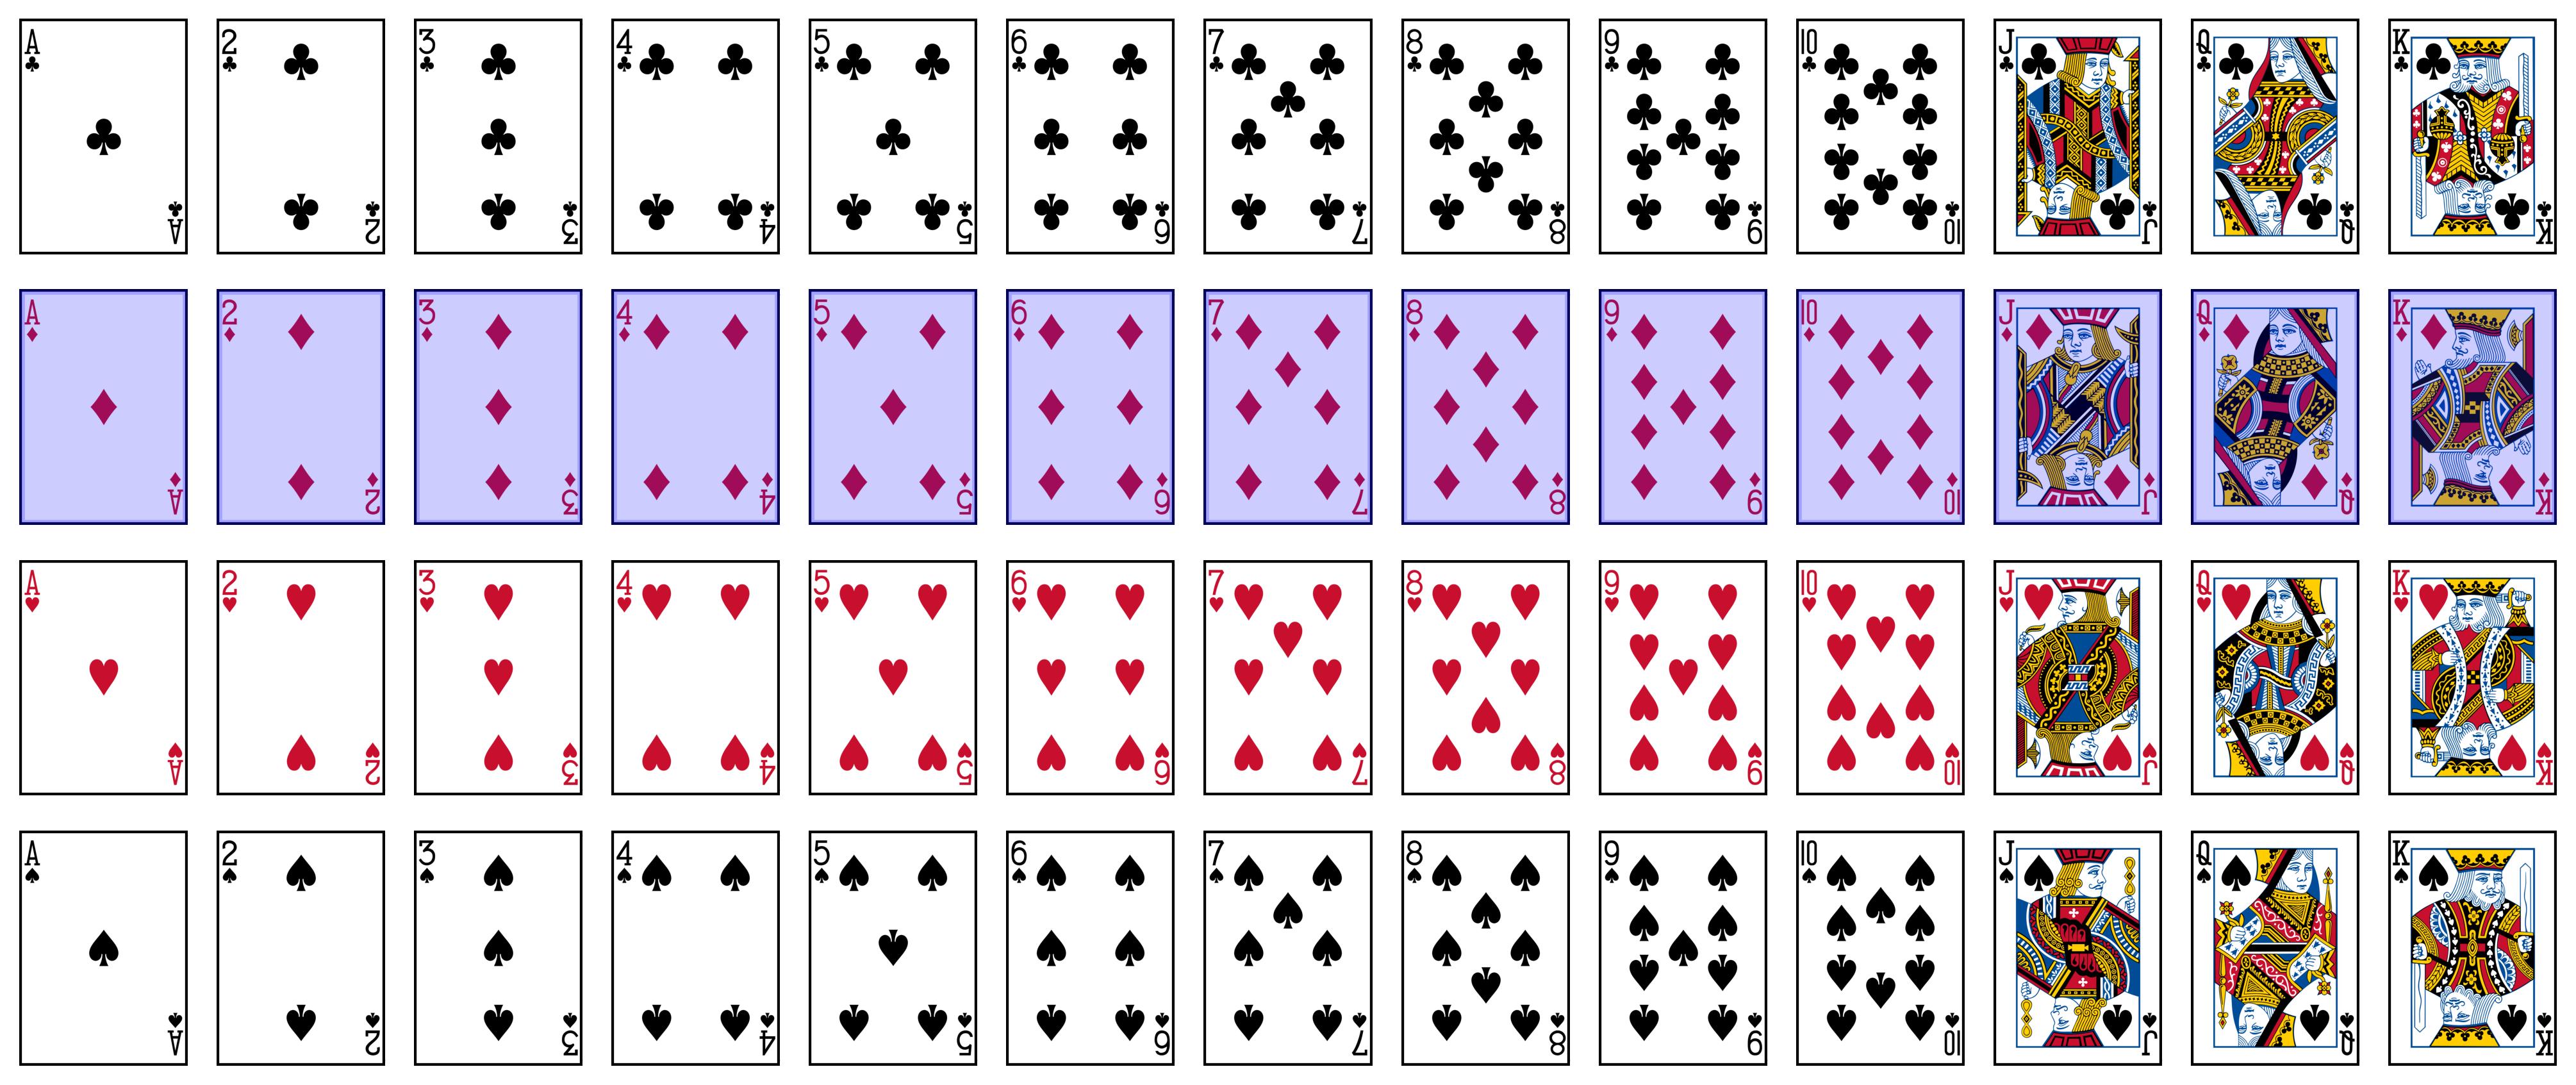
Fig. 3.38 Highlighted Diamond cards in the deck.#
Since the Queen of diamonds is counted in both \( Q \) and \( D \), we must subtract the overlap:
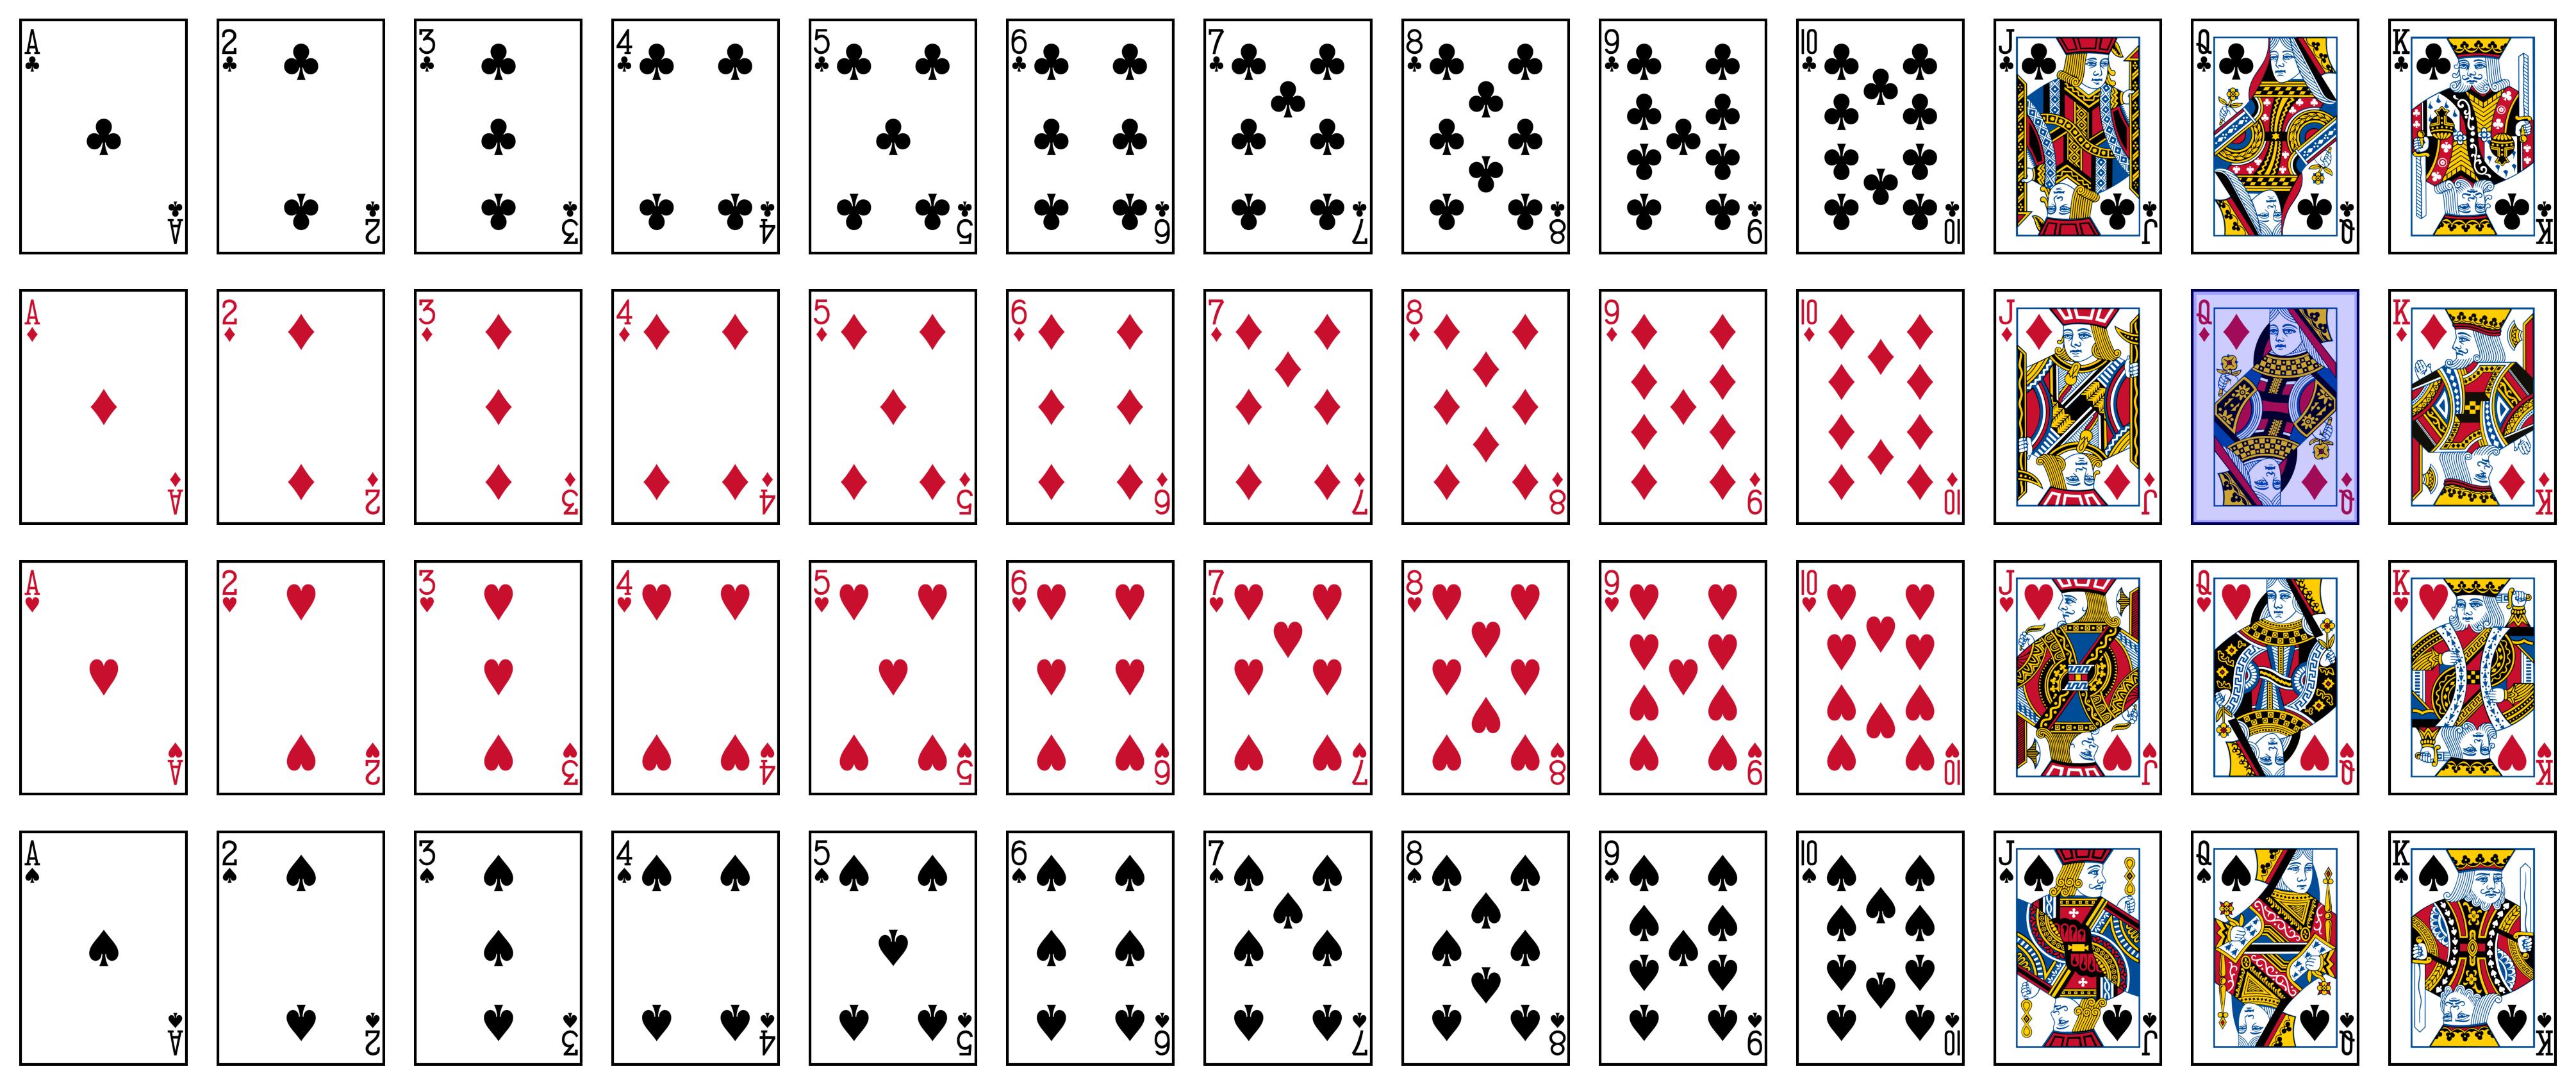
Fig. 3.39 Highlighted Queen of Diamonds.#
Thus, the probability of drawing a Queen or a Diamond card is:
c) Probability of Drawing a Card That Is Either a Number 2 or a Black Card: Let \(N\) be the event of drawing a number 2 card and \(B\) be the event of drawing a black card (spades or clubs). We have:
There are 4 two cards.
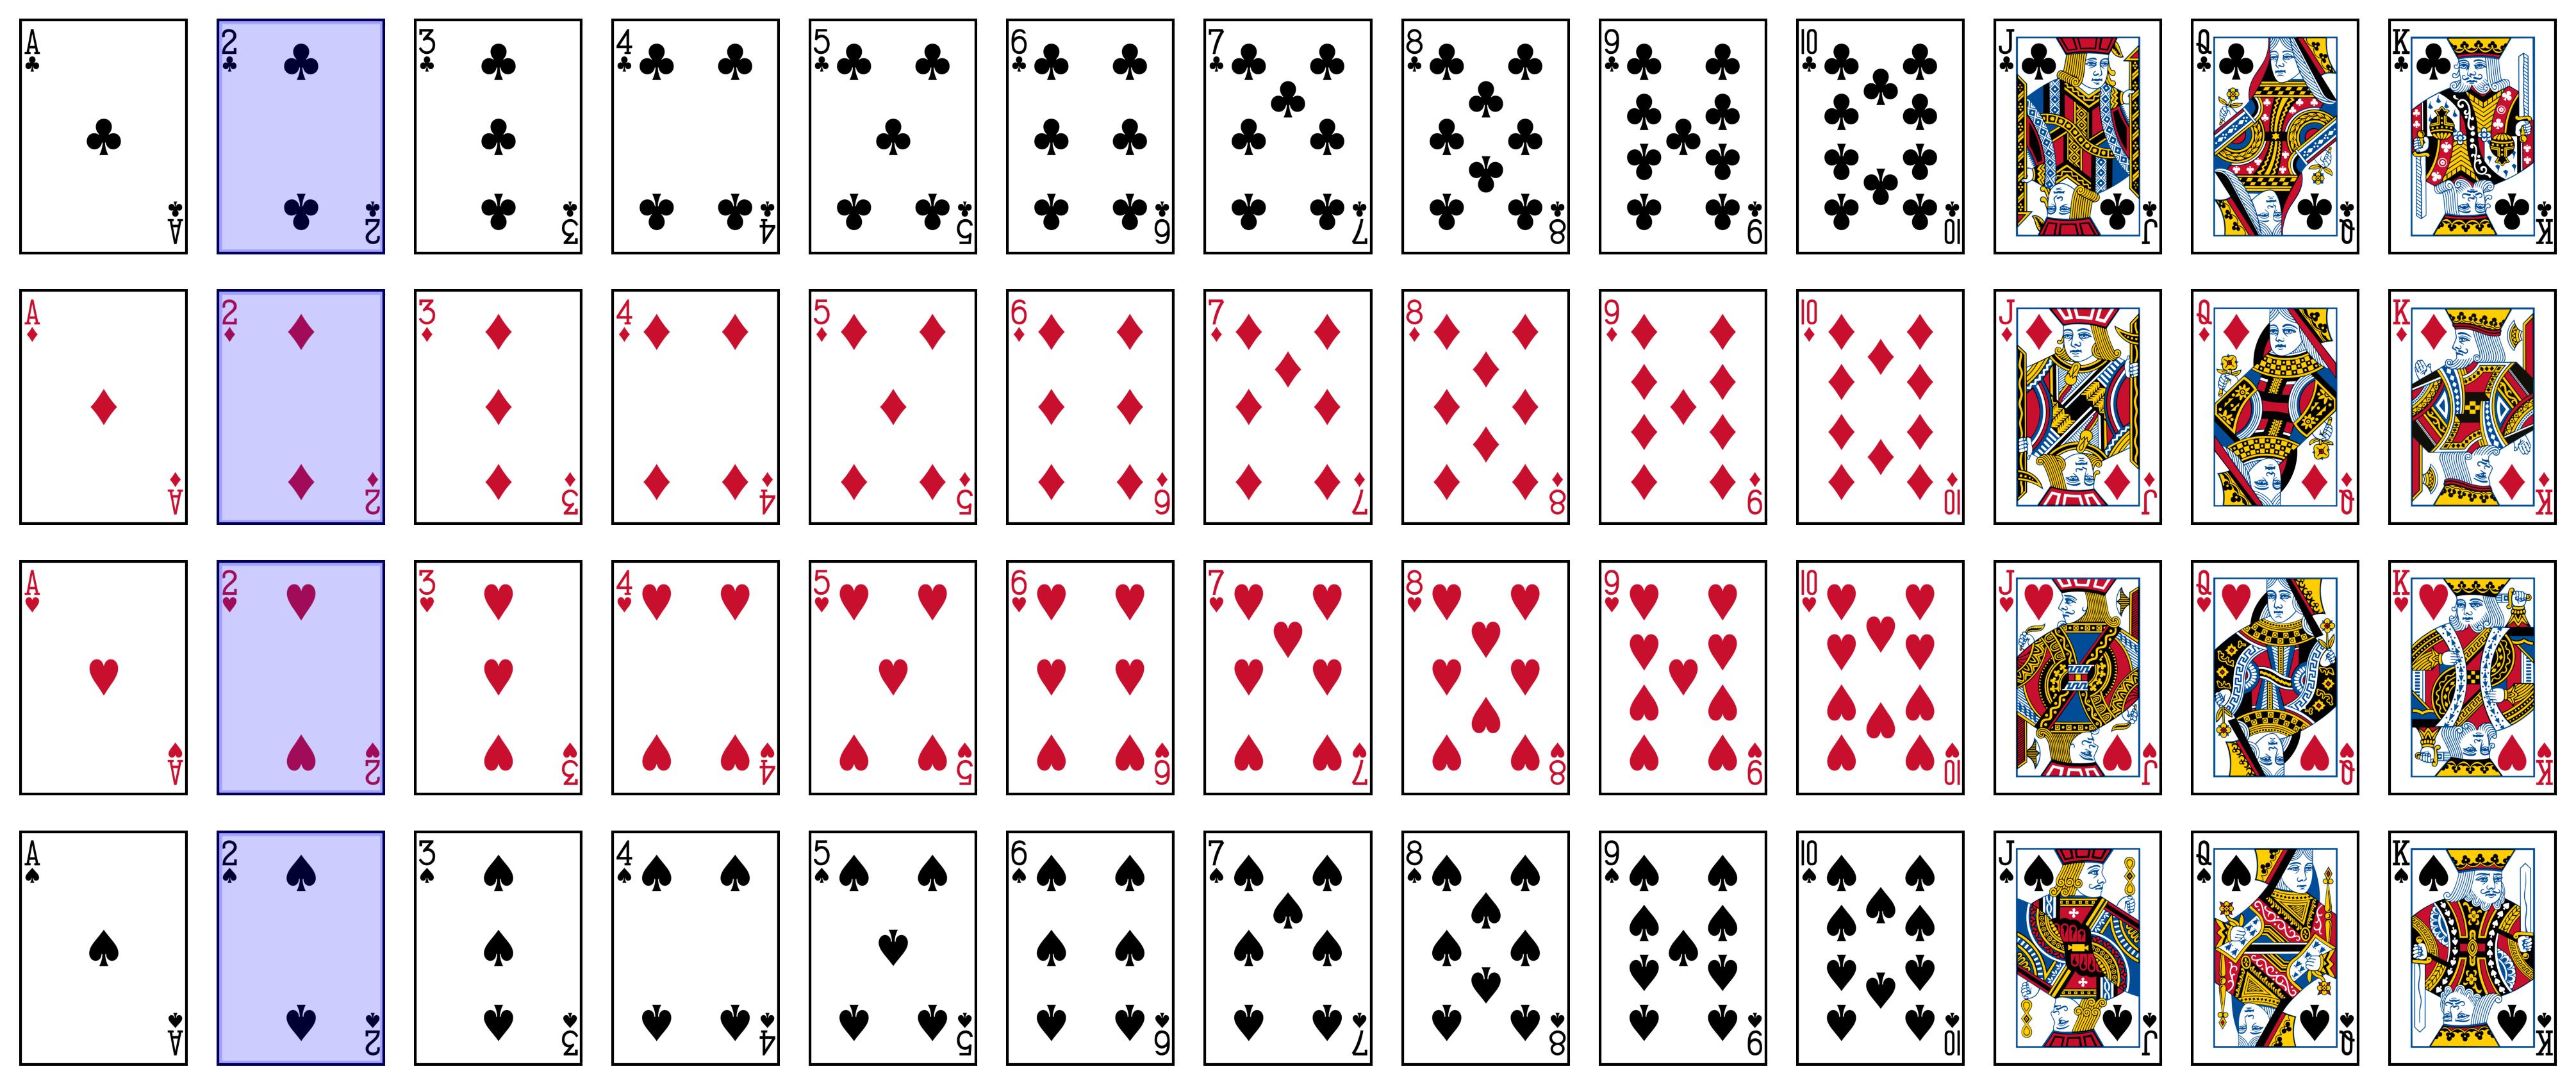
Fig. 3.40 Highlighted number 2 cards in the deck.#
There are 26 black cards.
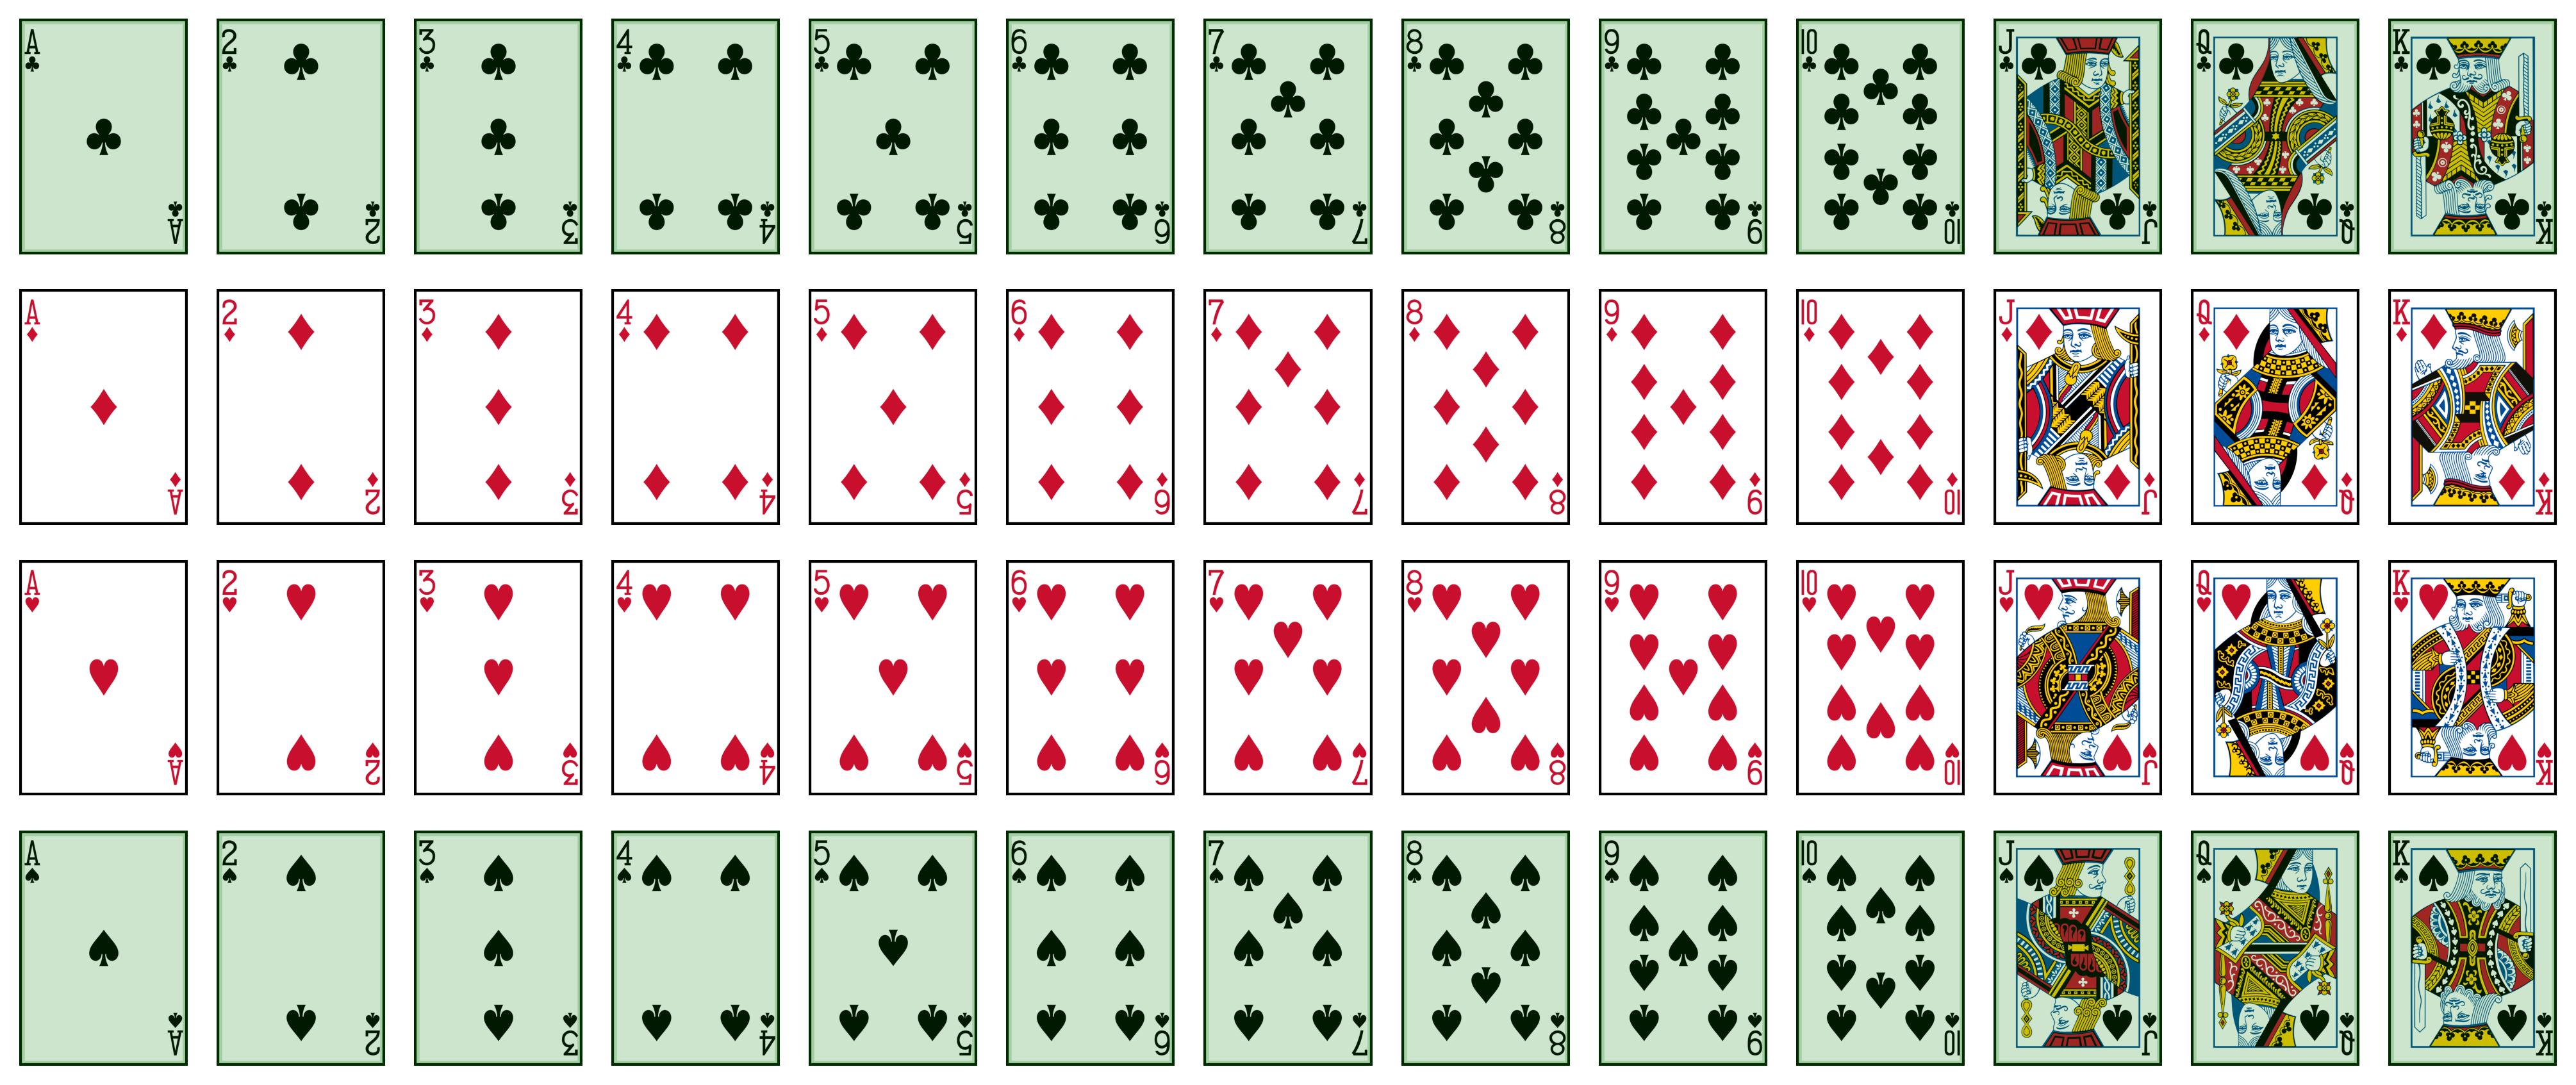
Fig. 3.41 Highlighted black cards in the deck.#
Since the 2 of spades and the 2 of clubs are counted in both \( N \) and \( B \), we must subtract the overlap:
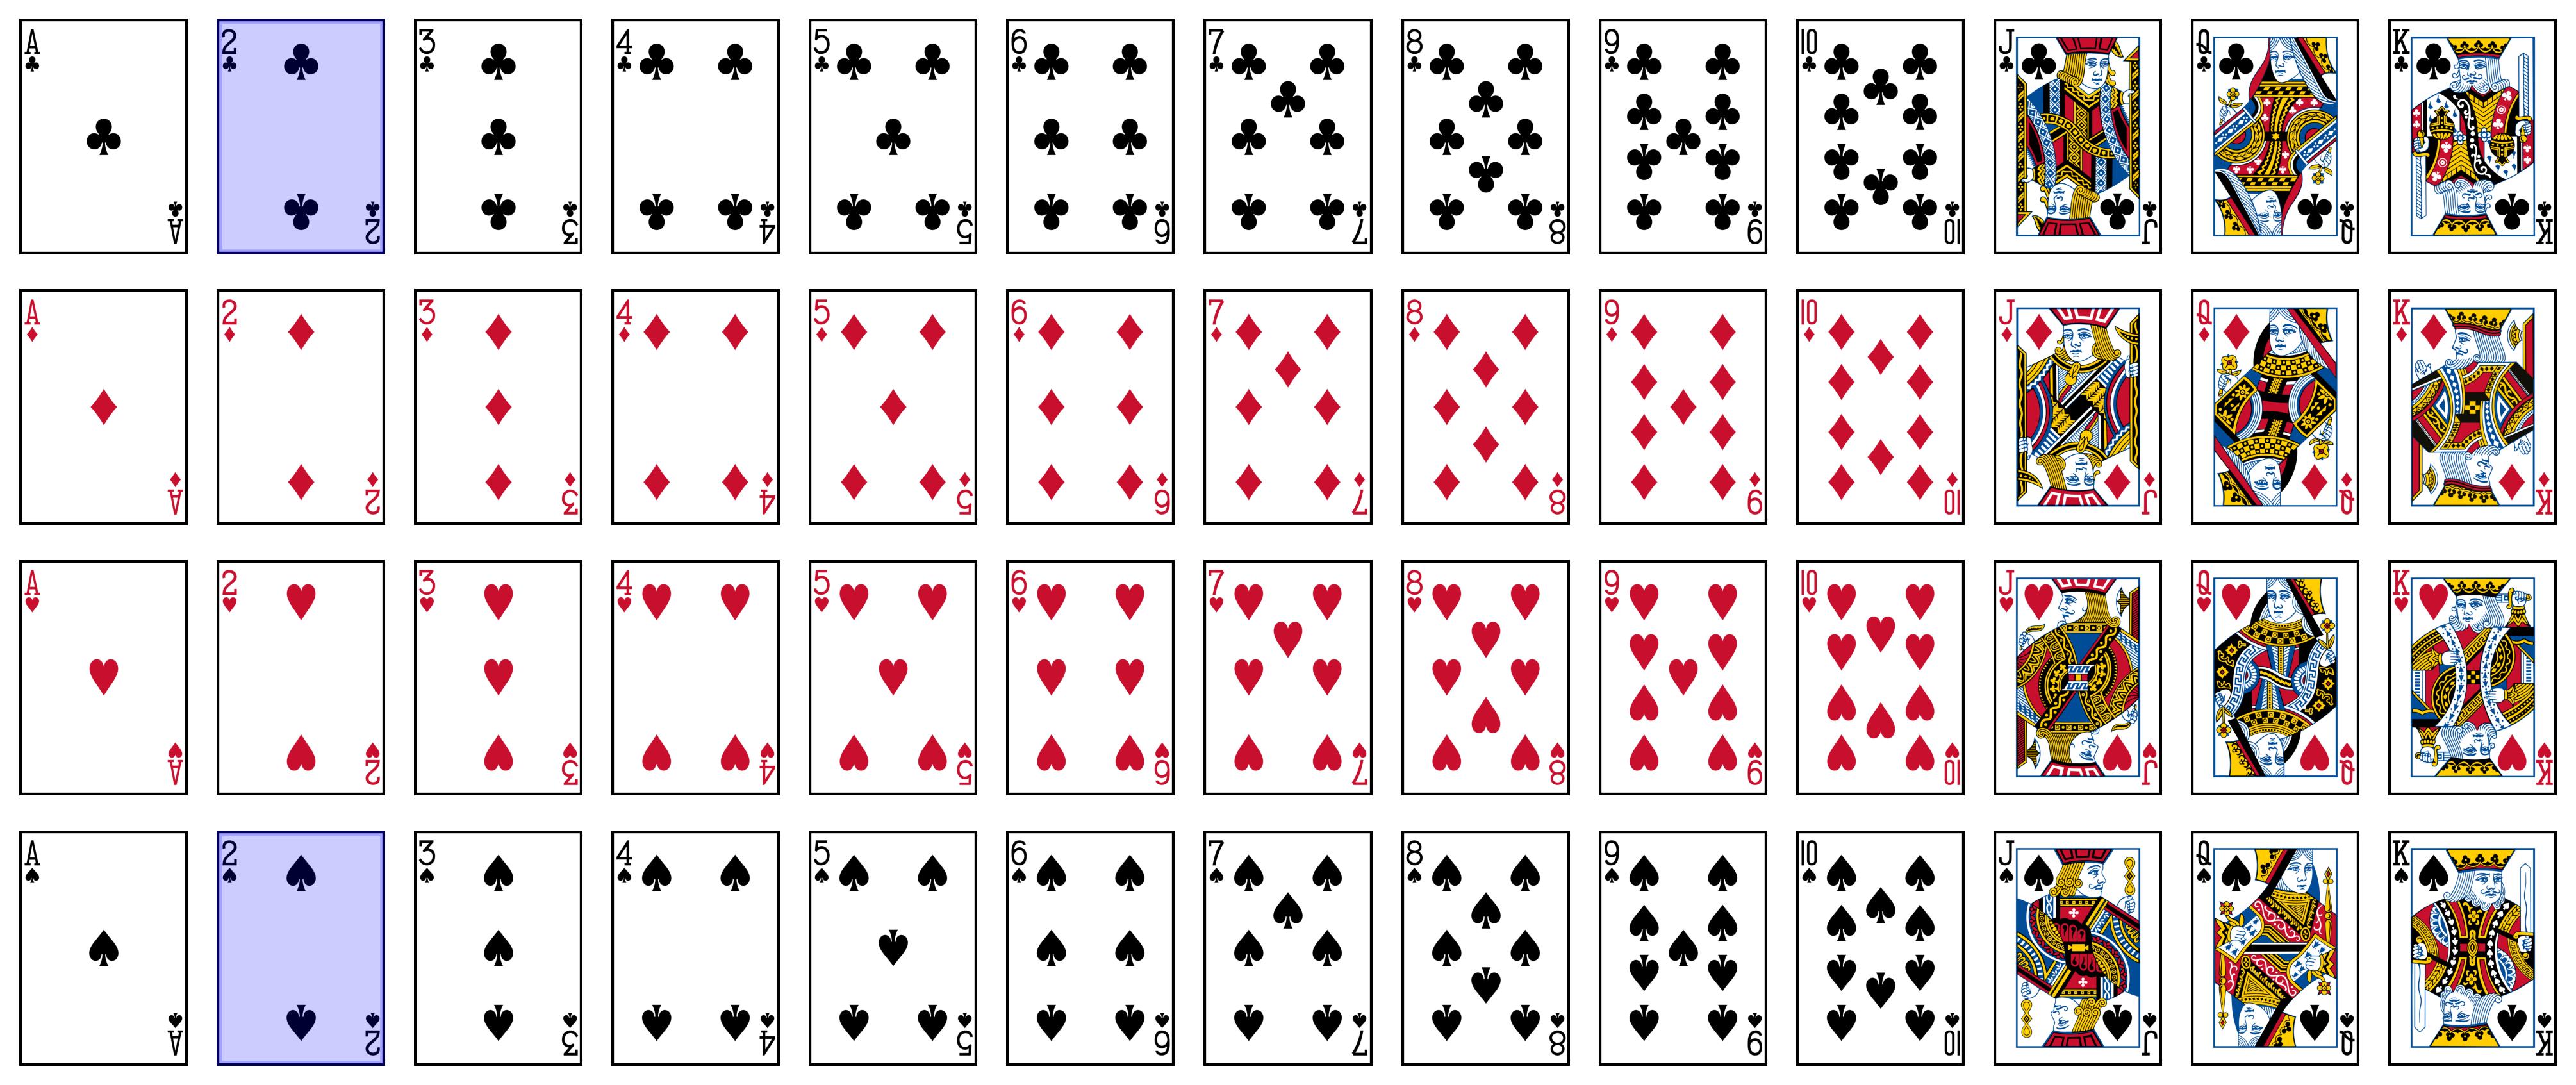
Fig. 3.42 Highlighted number 2 black cards.#
Thus, the probability of drawing a card that is either a number 2 or a black card is:
