3.2. Tree and Venn Diagrams#
3.2.1. Tree Diagram#
A tree diagram is a graphical representation commonly used to analyze the possible outcomes of an experiment. It consists of branches that are labeled with either frequencies or probabilities, allowing us to understand and calculate probabilities more intuitively. Tree diagrams are particularly useful for visualizing and solving probability problems [Devore et al., 2021].
The diagram starts with a single “root” node, representing the initial stage or starting point of the experiment. From the root node, branches extend outward, each corresponding to a possible outcome at that stage. As the experiment progresses through different stages, additional nodes and branches are added to represent the various possibilities and their associated probabilities or frequencies [Grote and Hefazi, 2021].
Tree diagrams are versatile tools for handling complex scenarios, especially those involving sequential events or decision-making processes. By visually organizing and structuring the outcomes and their probabilities, tree diagrams enable us to better comprehend the likelihood of specific events occurring.
Example 3.5
Consider an urn experiment with two balls: one red (R) and one blue (B). We will draw two balls sequentially, with replacement after each draw. Let’s use a tree diagram to illustrate all possible outcomes:
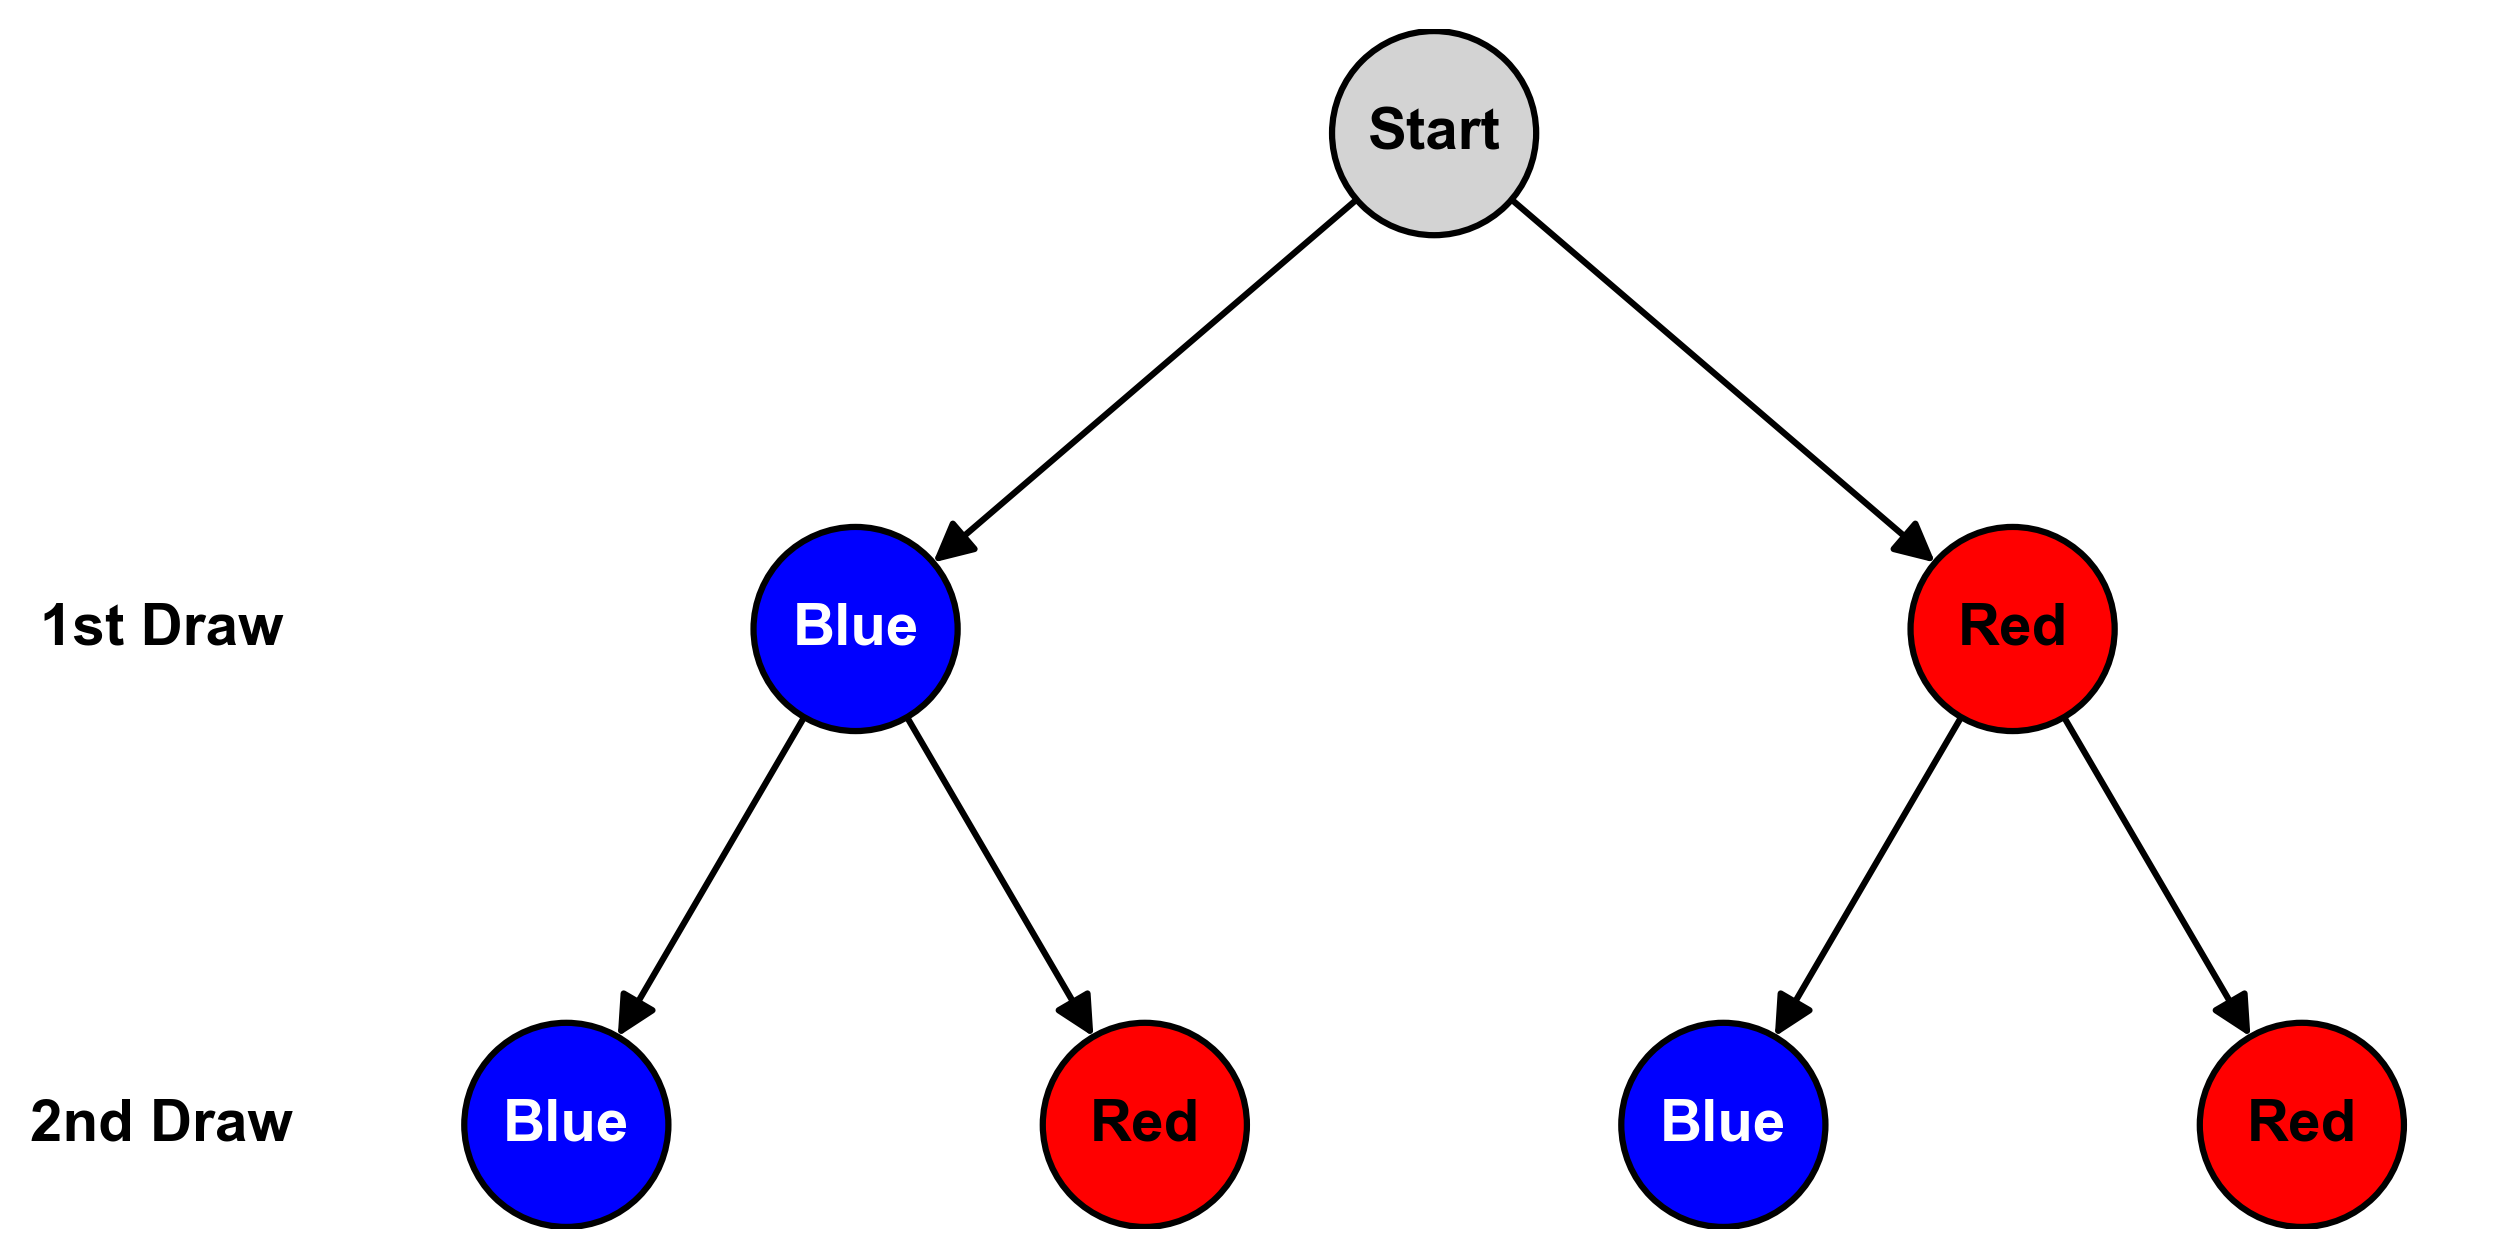
Fig. 3.12 Tree diagram illustrating the outcomes of drawing two balls with replacement from an urn containing one red and one blue ball. Each branch represents a possible draw, with probabilities shown on the branches and final outcomes at the leaf nodes.#
Explanation of Fig. 3.12:
Root: Represents the starting point of the experiment.
First level: Shows the two possible outcomes of the first draw (R or B), each with a probability of 1/2.
Second level: Illustrates the outcomes of the second draw, again with probabilities of 1/2 for each option.
Leaf nodes: Display the four possible final outcomes (RR, RB, BR, BB) and their respective probabilities.
Key observations:
There are four equally likely outcomes: RR, RB, BR, and BB.
Each outcome has a probability of 1/4, calculated by multiplying the probabilities along each path (1/2 × 1/2 = 1/4).
The symmetry of the diagram reflects the independence of each draw due to replacement.
Example 3.6 (Coin Tossing for Three Times)
Imagine tossing a 1-dollar coin three times. Determine the probability of getting at least two heads.
Solution: The sample space \(S\) represents all the possible outcomes of tossing a coin three times. Each outcome is a sequence of heads (\(H\)) and tails (\(T\)). Since a coin has two sides, each toss has two possible results. When we toss the coin three times, the number of possible outcomes is \(2 \times 2 \times 2 = 8\), because each toss is independent of the others.
List all the possible outcomes:
On the first toss, we can get either heads (\(H\)) or tails (\(T\)).
For each of those outcomes, the second toss also results in either heads (\(H\)) or tails (\(T\)).
The third toss, again, can be heads (\(H\)) or tails (\(T\)) for each of the outcomes from the first two tosses.
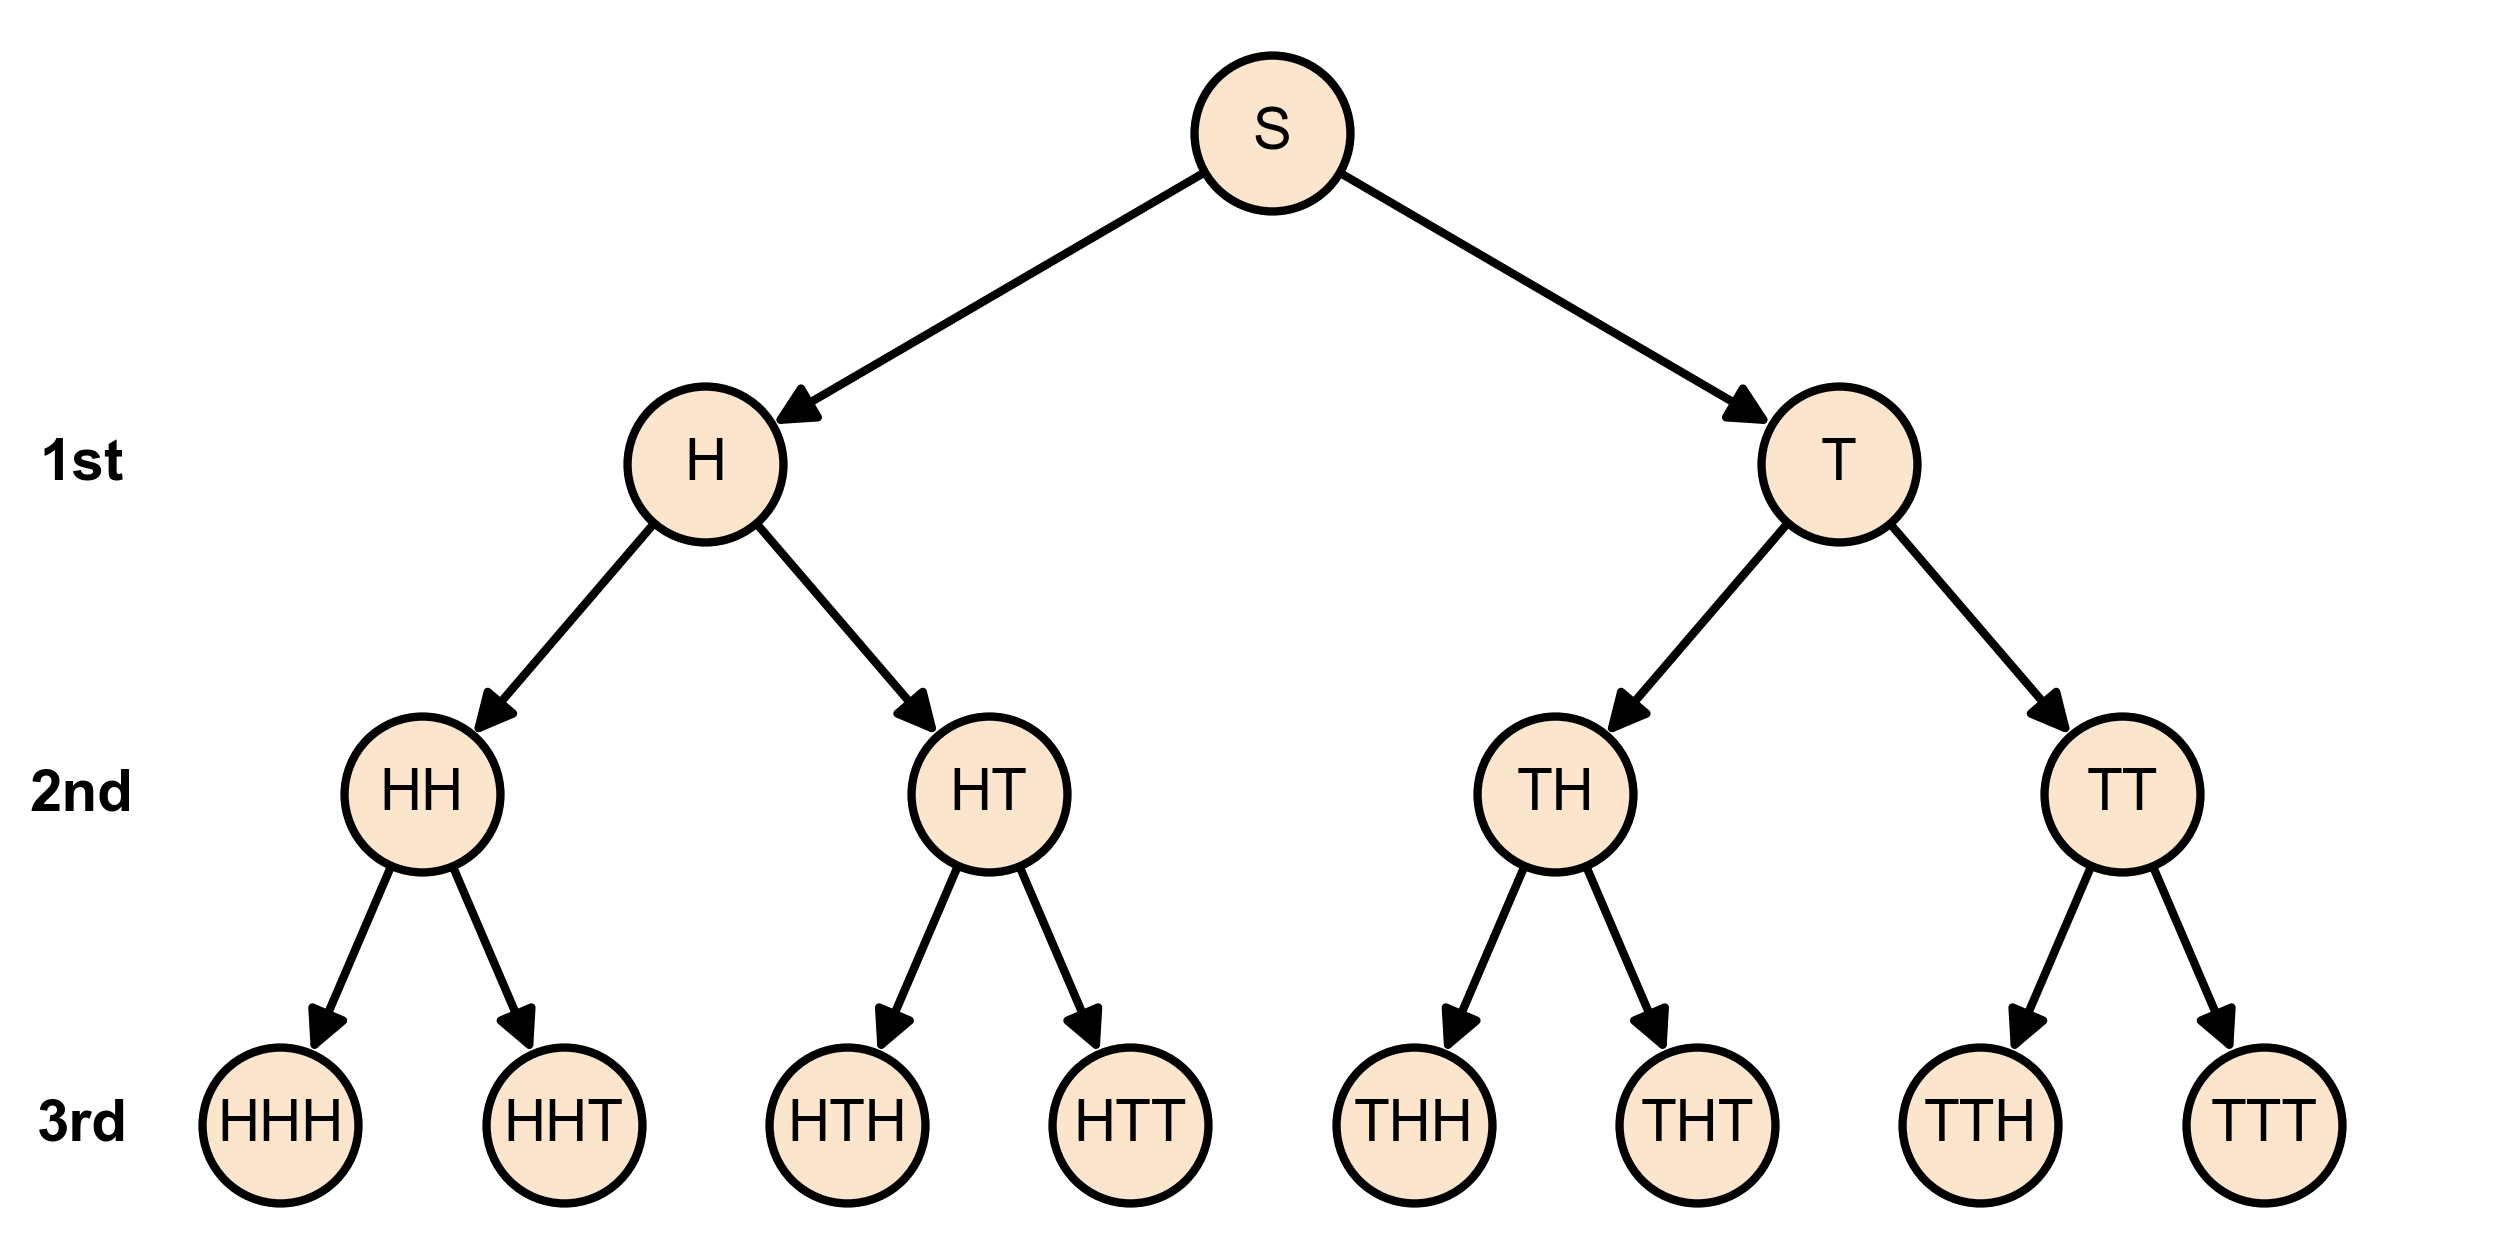
Fig. 3.13 Tree diagram showing all possible outcomes of tossing a coin three times.#
By listing out every combination of these results, we get the sample space \(S\):
Each element in the set represents a different combination of heads and tails over the three tosses. For example, “HTH” means the first toss resulted in heads, the second in tails, and the third in heads again.
Now, let’s define event \(C\) as “getting at least two heads.” This event includes the outcomes where two or more heads appear:
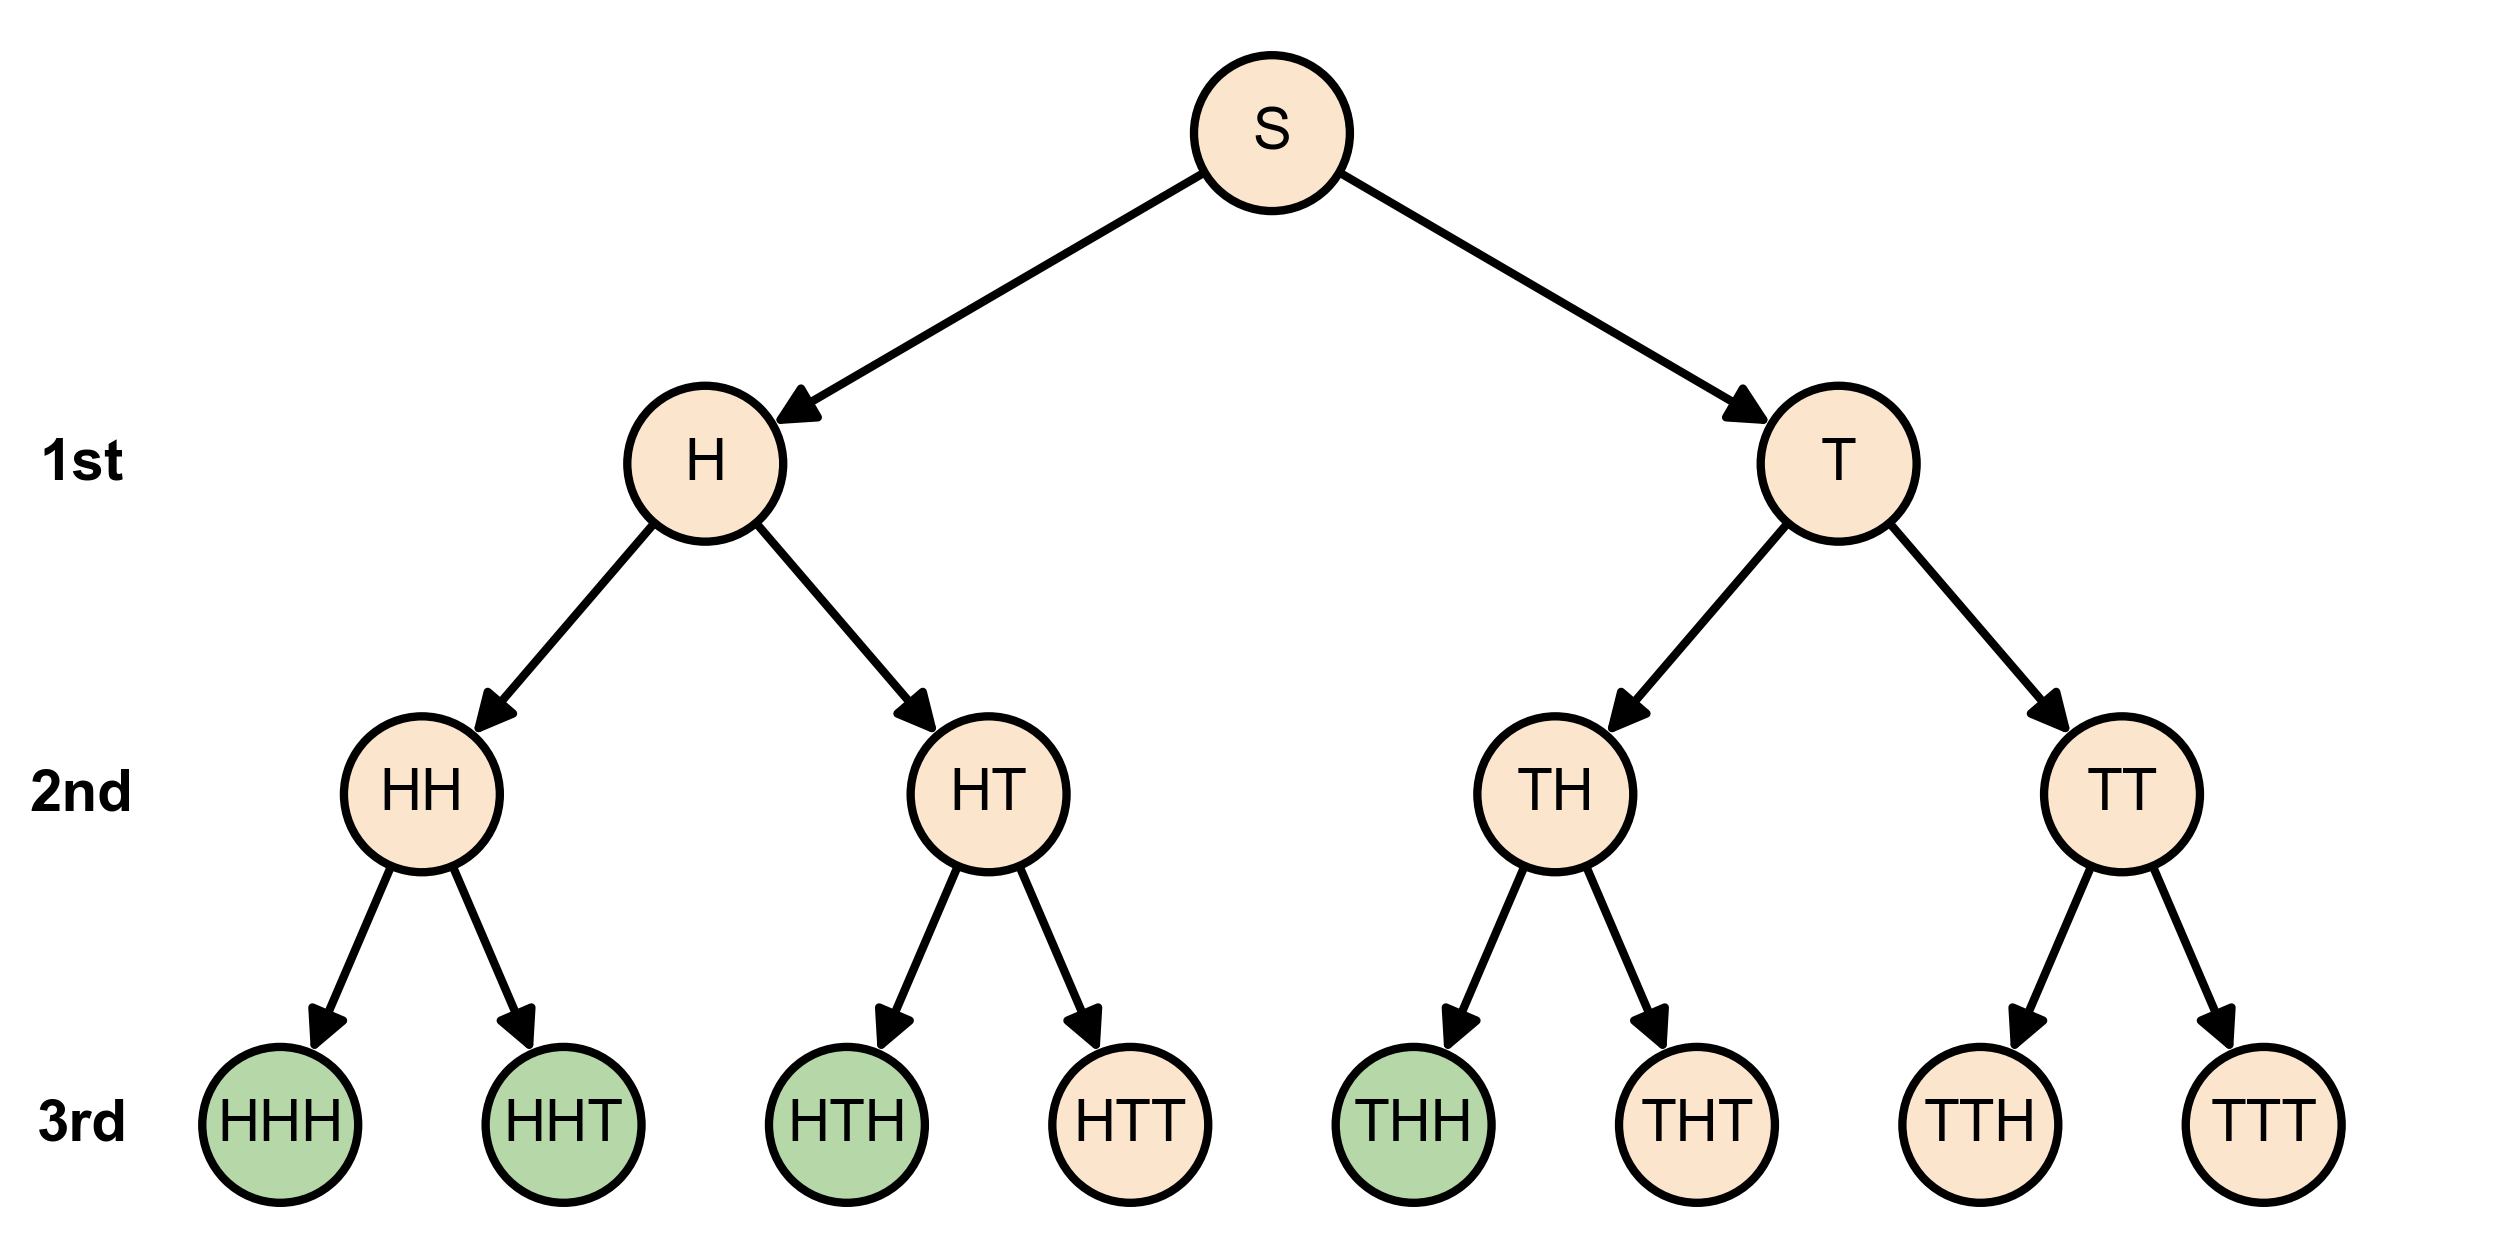
Fig. 3.14 Tree diagram showing all possible outcomes with the favorable cases for getting at least two heads highlighted in green.#
To find the probability of event \(C\), we calculate it as the number of favorable outcomes for \(C\) divided by the total number of outcomes in \(S\):
The number of favorable outcomes for event C is the count of outcomes in set C, which is 4. The total number of outcomes in the sample space S is 8. Therefore, the probability of getting at least two heads when tossing a coin three times is:
This means there’s a 50% chance of getting at least two heads when tossing a coin three times.
3.2.2. Venn Diagram#
Definition - Venn Diagram
A Venn diagram is a visual representation that helps to illustrate the relationships between different sets or events within a sample space. It uses overlapping circles or ovals to depict these relationships.
The key elements of a Venn diagram are as follows [Heiberger and Holland, 2015]:
Sample Space (S): The sample space, denoted by the outer bounding box, represents the entire set of possible outcomes or elements in a given context or experiment. It includes all possible elements relevant to the scenario under consideration.
Sets or Events: The circles or ovals within the sample space represent specific subsets or events related to the experiment. Each circle corresponds to a particular category or condition.
Overlapping Regions: When the circles or ovals intersect, it creates overlapping regions. These intersections represent the elements that belong to both of the corresponding sets or events. The overlapping areas help to identify common elements between different categories.
Non-overlapping Regions: The areas inside each circle but outside the overlapping regions are exclusive to that particular set or event. These regions show the elements that are unique to each category.
Elements Outside the Circles: Elements that do not fall within any of the circles or ovals are not part of the sets or events being considered in the Venn diagram.
The purpose of a Venn diagram is to visualize and understand the relationships between various sets or events and identify commonalities and differences among them. It is commonly used in mathematics, statistics, logic, and various other fields to analyze and illustrate data, probabilities, and logical relationships.
Example 3.7
The Venn diagram, Fig. 3.15, visually represents the relationship between two sets, A and B:
Set A: Contains the numbers 1, 2, 3, 4, 5, 6, 7.
Set B: Contains the numbers 6, 7, 8, 9, 10, 11.
Intersection: The common elements between sets A and B are 6 and 7.
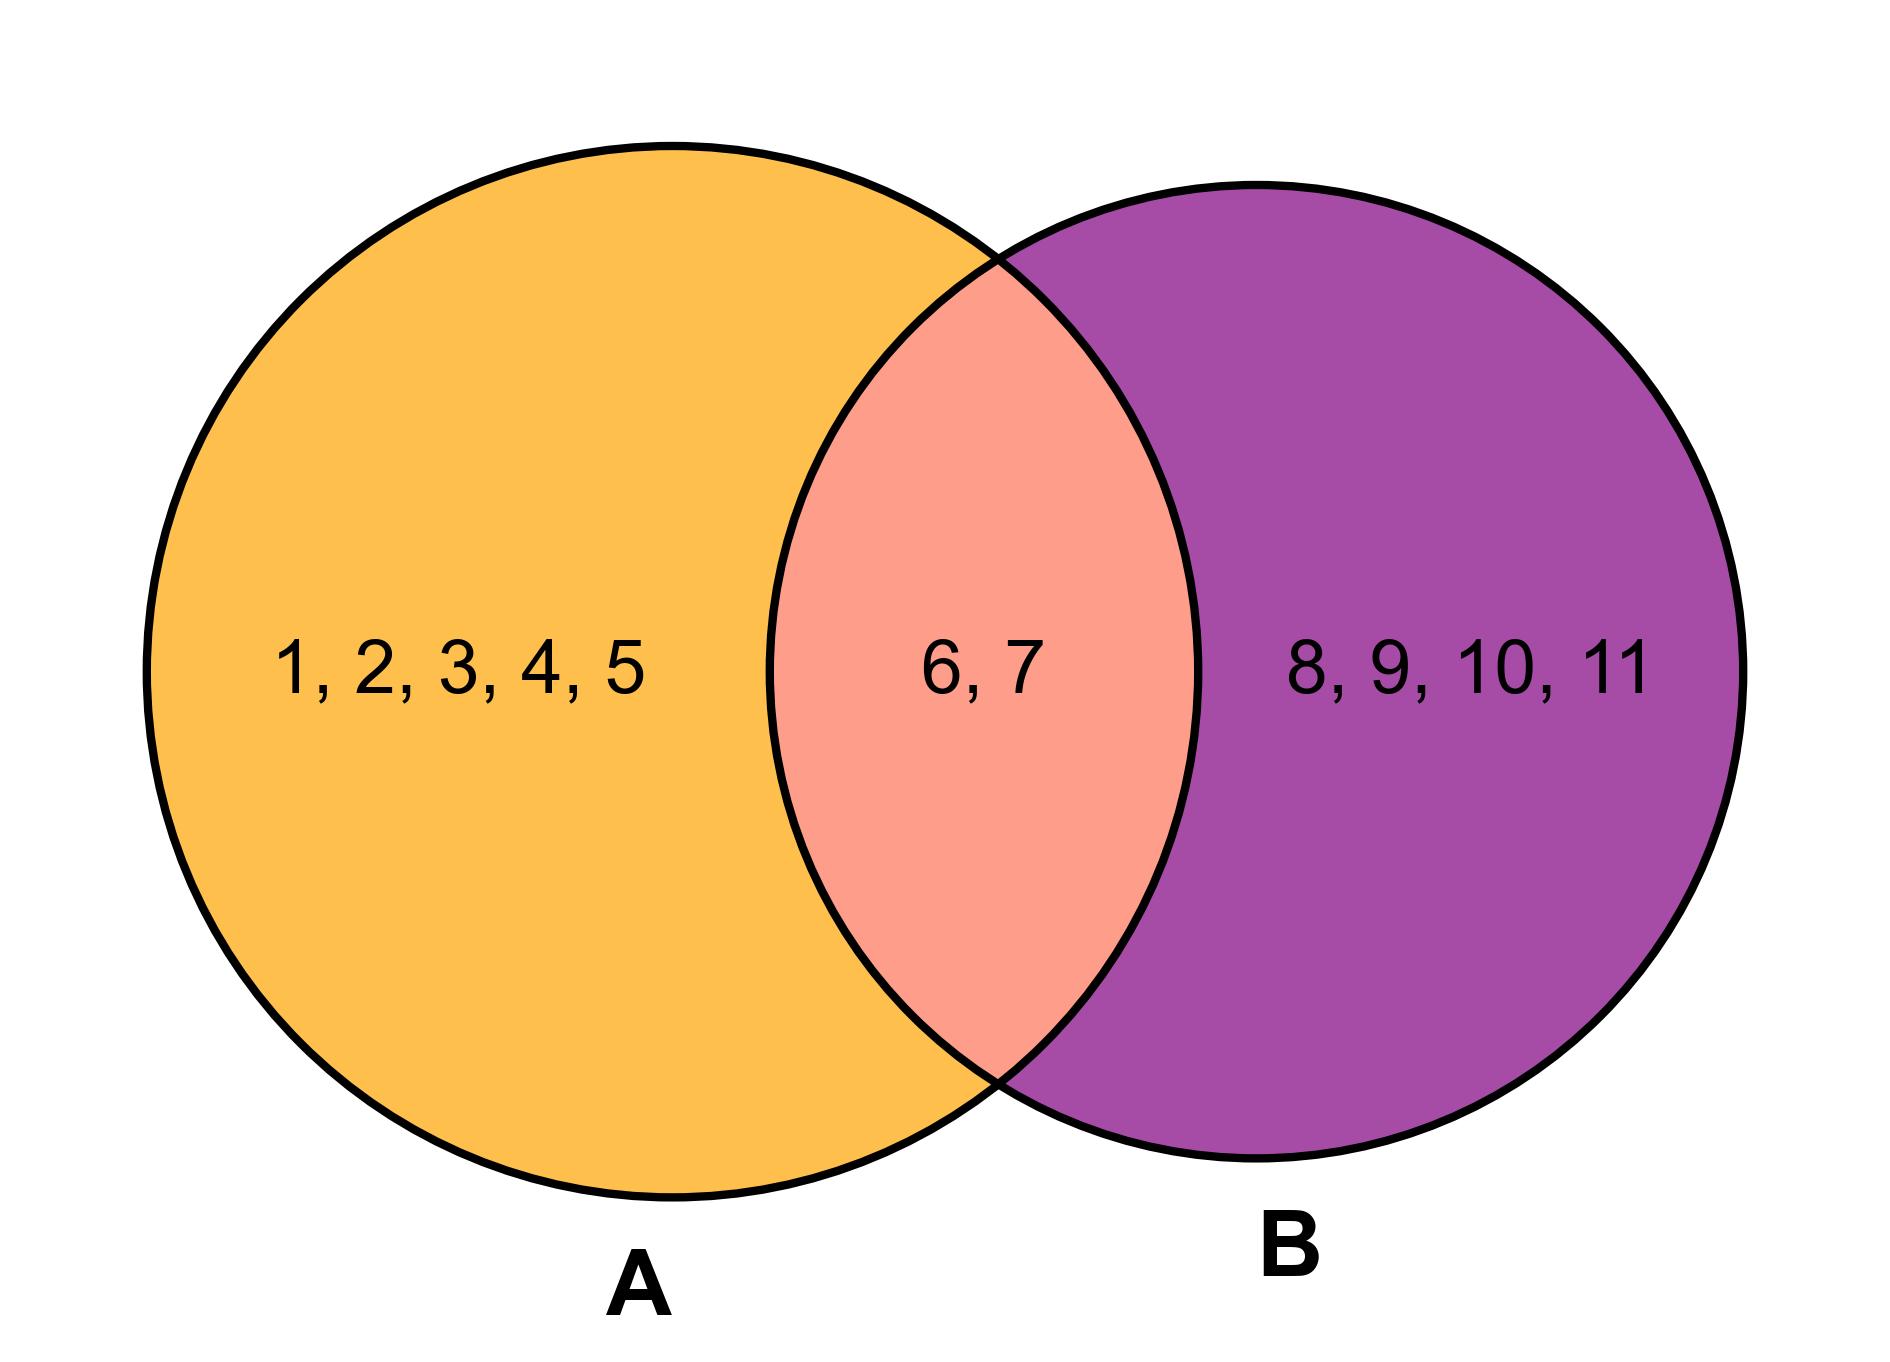
Fig. 3.15 Venn Diagram of Sets \(A\) and \(B\)#
Example 3.8
The Venn diagram, Fig. 3.16, visually represents the relationship between two sets, \(C\) and \(D\):
Set \(C\): Contains the numbers \(1, 3, 5\).
Set \(D\): Contains the numbers \(6, 8, 10, 12\).
No Intersection: There are no common elements between sets \(C\) and \(D\).
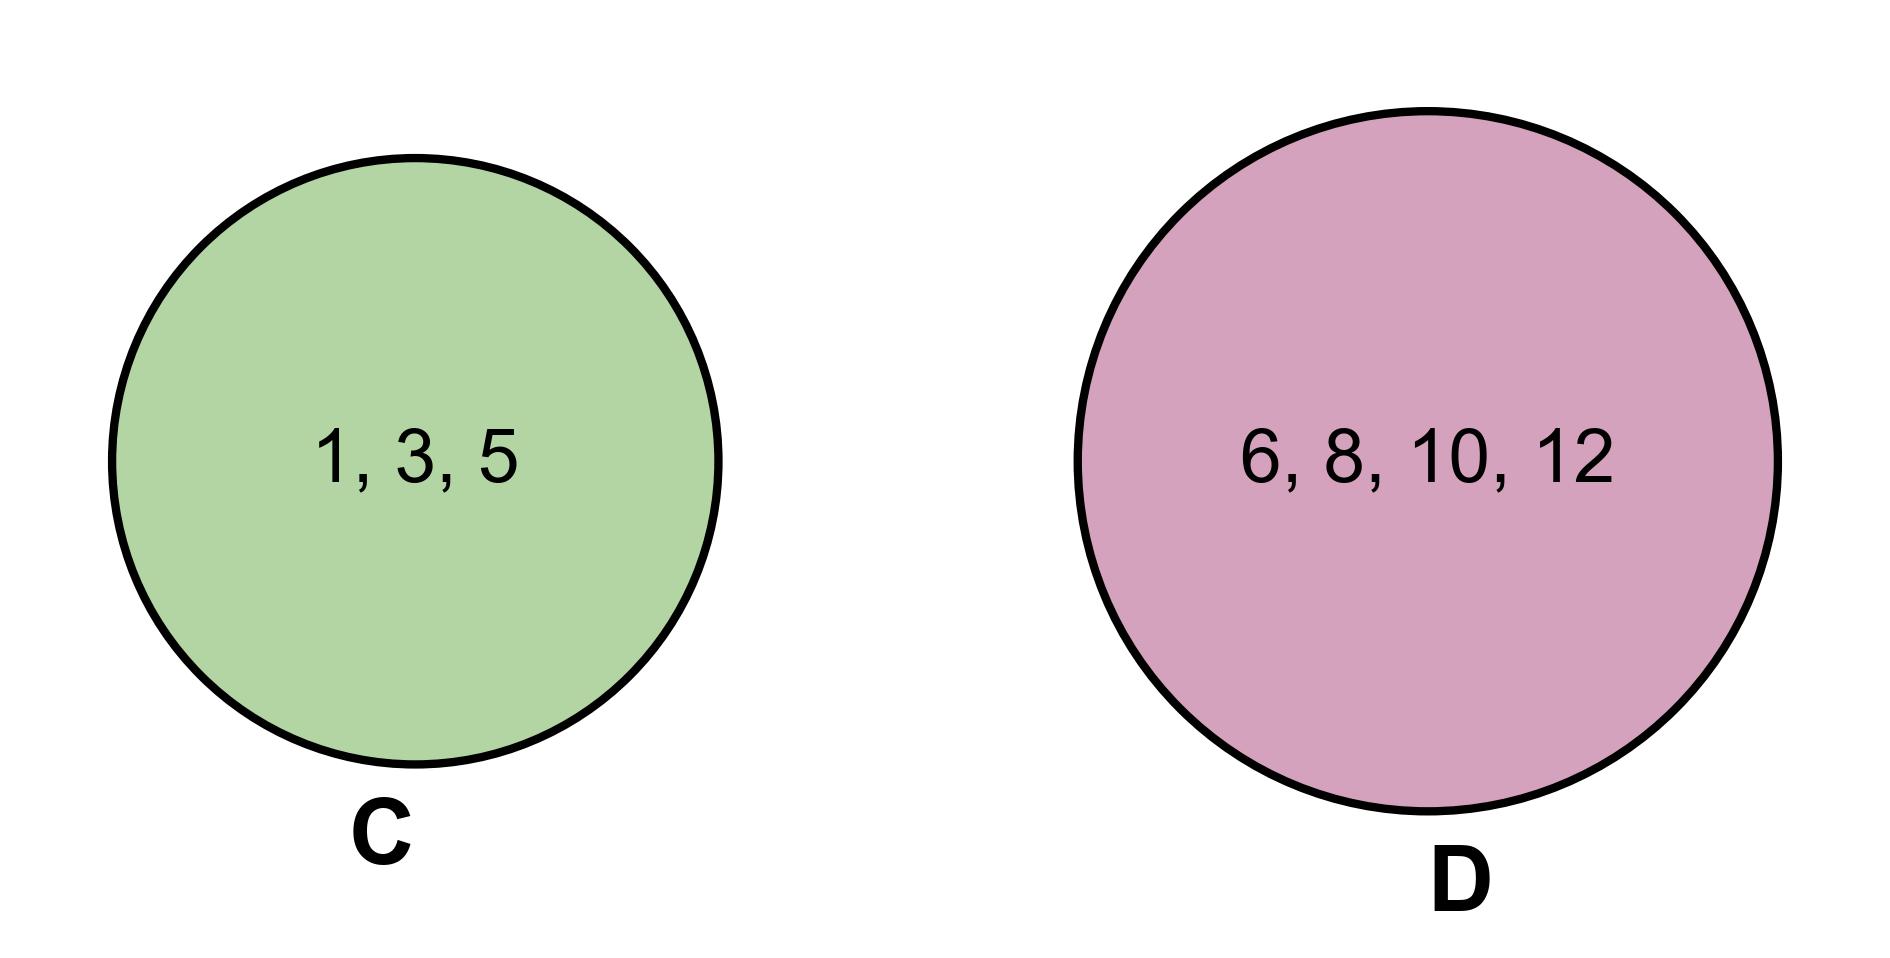
Fig. 3.16 Venn Diagram of Sets \(C\) and \(D\)#
Example 3.9
The Venn diagram, Fig. 3.17, visually represents the relationship between three sets, \(R\), \(G\), and \(B\):
Set \(R\) (Red): Contains the numbers \(1, 3, 5, 7, 9\).
Set \(G\) (Green): Contains the numbers \(4, 5, 6, 7, 8, 9, 10, 11\).
Set \(B\) (Blue): Contains the numbers \(2, 3, 4, 5, 7\).
Intersections:
\(R \cap G\): Contains the numbers \(5, 7, 9\).
\(R \cap B\): Contains the numbers \(3, 5, 7\).
\(G \cap B\): Contains the numbers \(4, 5, 7\).
\(R \cap G \cap B\): Contains the numbers \(5, 7\).
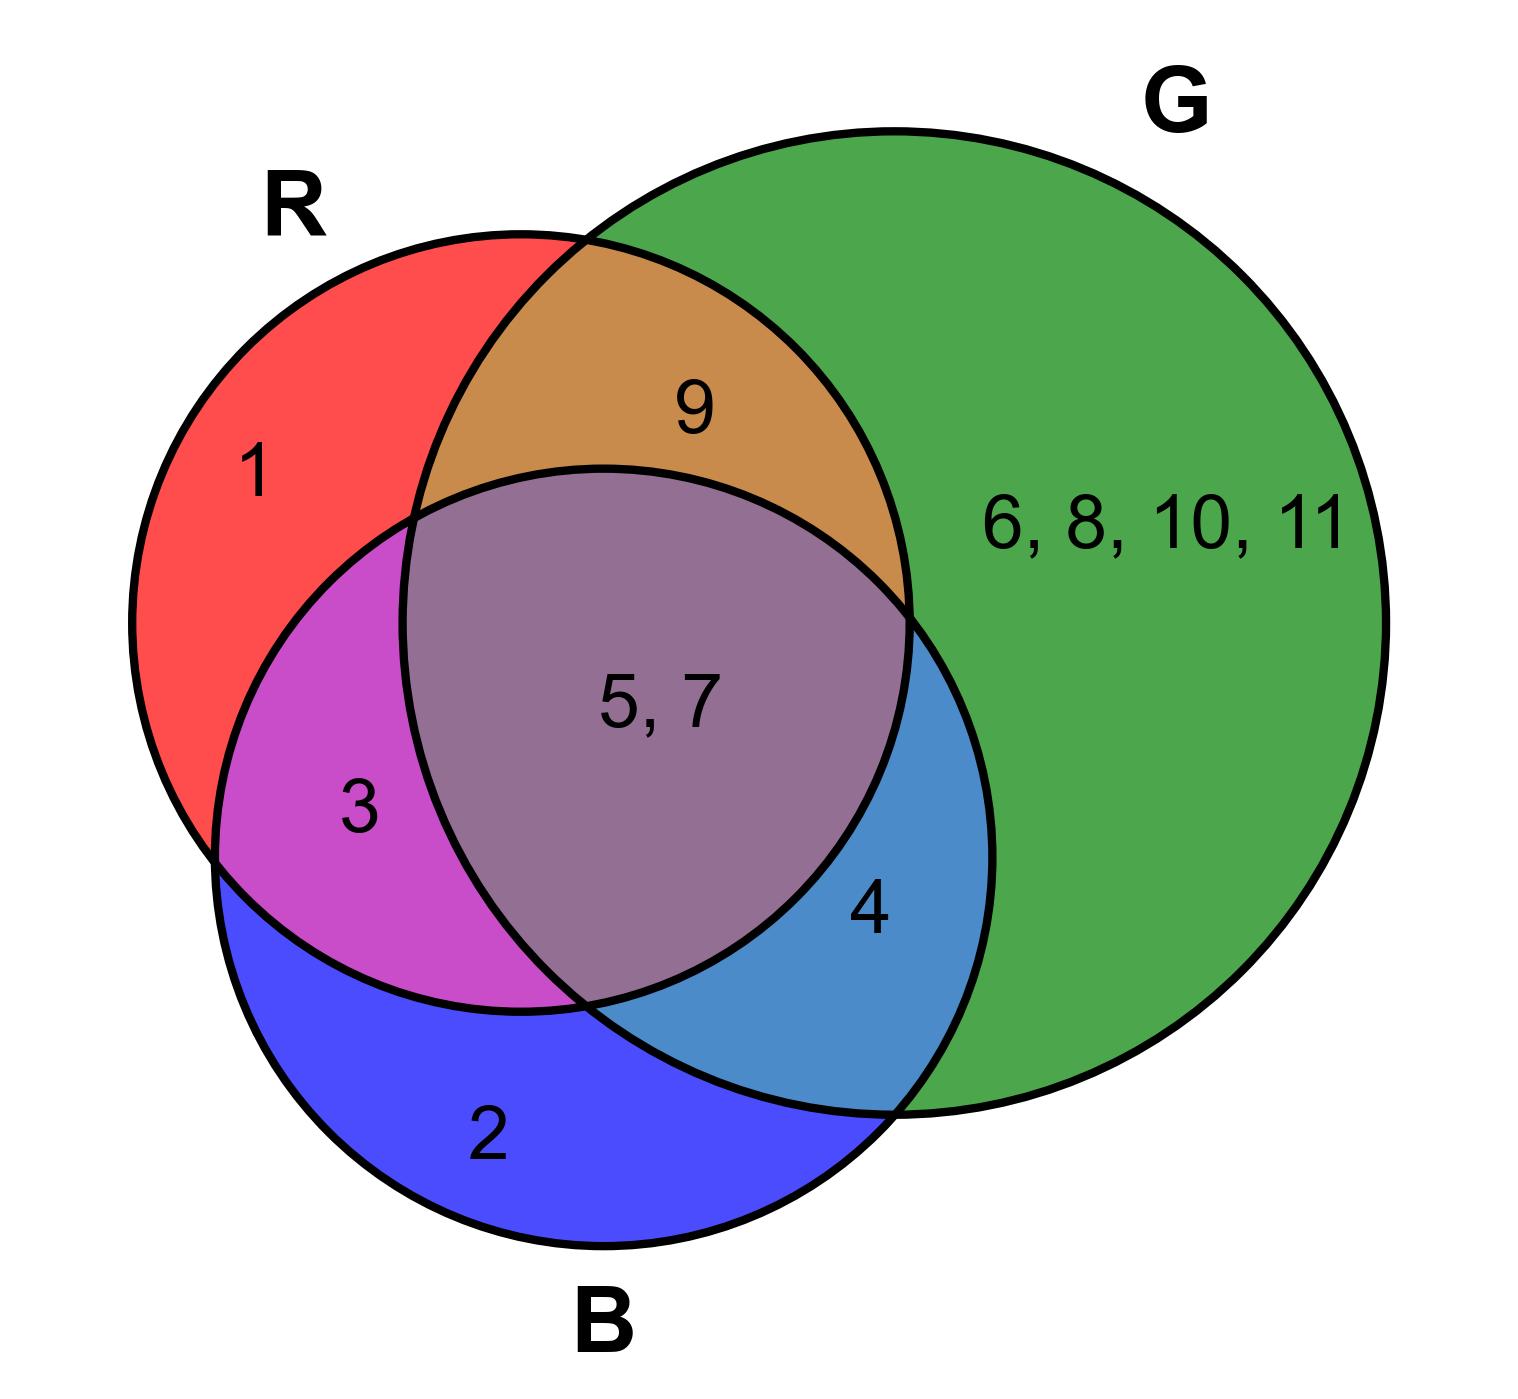
Fig. 3.17 Venn Diagram of Sets \(R\), \(G\), and \(B\)#
