3.1. What is Probability?#
3.1.1. Understanding Probability: The Basics#
Probability measures the likelihood of an event occurring or a statement being accurate. It’s a tool commonly used not just in scientific research but also in our daily lives to make informed decisions. Below are some foundational aspects of probability [Batanero et al., 2016]:
Probability Scale:
The scale of probability is from \(0\) to \(1\).
A probability close to \(1\) indicates a high likelihood of the event.
Conversely, a probability near \(0\) suggests a low likelihood.
Fig. 3.1 represents a probability scale using a gradient of purple colors, ranging from 0 to 1. This scale provides a visual interpretation of the likelihood of events:
Impossible (0): Represents an event with no chance of occurring.
Unlikely (0.2): Indicates a low probability, suggesting the event is not expected to happen.
50-50 (0.5): Denotes an equal chance of the event occurring or not, akin to flipping a fair coin.
Likely (0.8): Implies a high probability, suggesting the event is expected to happen.
Certain (1): Represents an event that is guaranteed to occur.

Fig. 3.1 Probability scale: Visualizing the likelihood of events from impossible to certain.#
Absolute Outcomes:
An event with a probability of \(0\) is deemed impossible.
Conversely, an event is deemed certain if its probability is \(1\).
Forms of Expression:
Probability can be expressed in various forms: as percentages, decimals, or fractions.
To convert a probability from a fraction to a percentage, you multiply it by \(100\%\).
3.1.2. Interpretations of Probability#
Empirical Probability (Relative Frequency Interpretation):
This practical approach uses historical data to estimate the likelihood of future outcomes.
In experiments, the sample space (denoted as \(S\)) encompasses all conceivable outcomes, though individual results may remain unpredictable.
Theoretical Probability (Classical Approach):
This method calculates probabilities based on scenarios where outcomes are equally probable.
For instance, tossing a balanced six-sided die yields a \(\dfrac{1}{6}\) probability for each number to appear.
Subjective Probability:
These probabilities mirror an individual’s personal judgment or confidence level.
They are particularly useful in scenarios involving decision-making and evaluating risks.
Examples:
Geochemistry: A geochemist may assess that there’s a 90% likelihood of encountering elevated methane and harmful hydrocarbons in water sources near fracking sites.
Meteorology: A weather forecast might predict an 85% chance of temperatures exceeding 3°C at 1:15 p.m. tomorrow, with a 65% chance of rainfall commencing by 1:20 p.m.
Pipeline Safety: A pipeline company claiming a “99.999% safety record” expresses a strong assurance in their operational security.
Healthcare Decisions: Medical professionals might convey probability as a patient’s even odds of surviving a surgery or a 95% probability of a diagnosis.
3.1.3. Outcome and Events#
Definition - Outcome
An outcome represents a possible result or observation that can occur in an experiment or random event. When conducting an experiment, there are various potential outcomes, and each outcome has a specific probability associated with it.
For instance, when rolling a six-sided die, the possible outcomes are the numbers 1 through 6.
Definition - Event
Events are collections of outcomes. In probability, they are often represented by uppercase letters like A or B.
For instance, in a coin flip experiment, event A could be defined as getting “at most one head,” which includes the outcomes of one head or none.
Definition - Simple Event
A simple event is an outcome or event that cannot be further broken down into simpler components. They are mutually exclusive, meaning only one can happen at a time.
Differences between outcomes and simple events include:
Outcomes can be complex, consisting of multiple simple events.
Simple Events are singular and cannot be decomposed further.
When two dice are rolled, the outcome “sum of 7” is composed of several simple events: (1+6), (2+5), (3+4), etc.
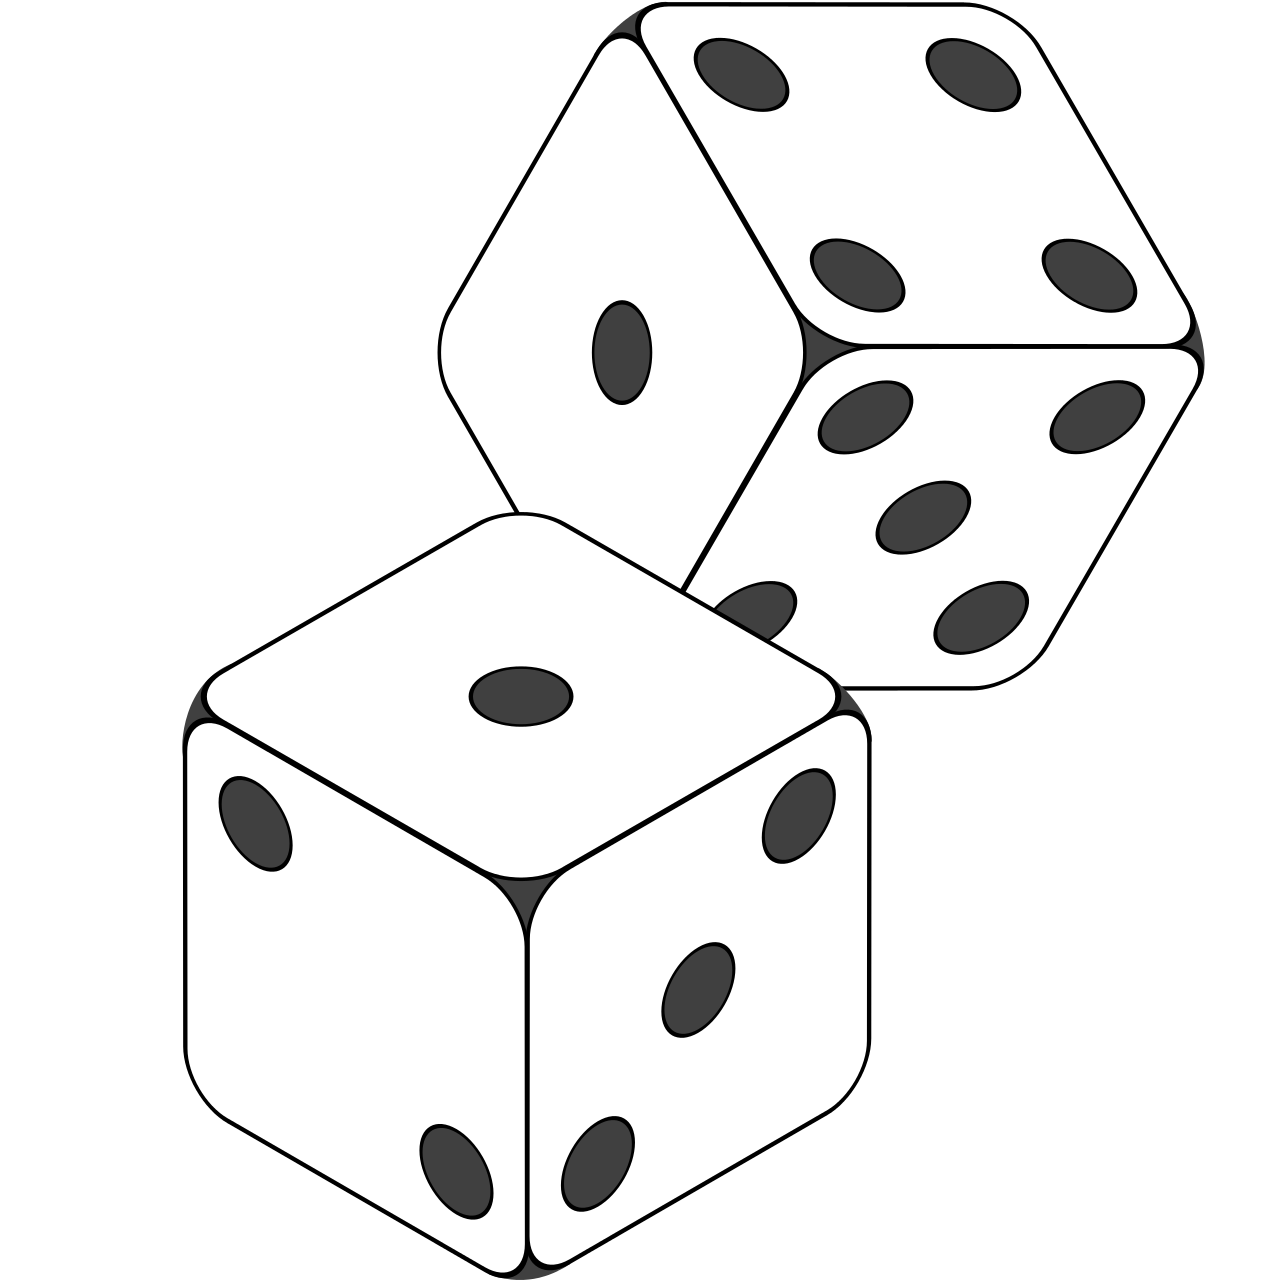
Fig. 3.2 Two standard gaming dice. Image is sourced from Wikipedia.#
3.1.4. Sample Space#
Definition - Sample Space
The sample space encompasses all possible simple events for a given procedure. It includes every outcome that cannot be further broken down or decomposed into smaller events. In essence, the sample space constitutes the complete set of all distinct and elementary outcomes that the procedure can yield.
As an illustration, consider the scenario of flipping one fair coin. In this case, the sample space, denoted as S, consists of two possible outcomes:
Where:
H represents Heads
T represents Tails
These are the only two elementary outcomes that can occur when flipping the coin. Understanding the sample space helps us analyze and quantify probabilities effectively.
Definition - Probability
The probability of an event \(A\) occurring is denoted as \(P(A)\) and is calculated as the ratio of the number of favorable outcomes (i.e., the outcomes in which event \(A\) occurs) to the total number of possible outcomes in the sample space (the set of all possible outcomes).
In a probabilistic experiment with \(N\) possible outcomes, where each outcome is equally likely to occur, the probability of an event \(E\) happening is determined by the number of ways that event can occur (denoted by \(f\)), divided by the total number of possible outcomes (\(N\)). Mathematically, it can be expressed as:
Where:
\(f\) is the number of favorable outcomes (i.e., the number of ways event \(E\) can occur).
\(N\) is the total number of possible outcomes in the experiment.
This formula is based on the assumption that all outcomes are equally likely, meaning that each outcome has an equal chance of occurring. By dividing the number of favorable outcomes by the total number of possible outcomes, we obtain the probability of the specific event \(E\) occurring in the experiment.
Probability for Equally Likely Outcomes (\(f/N\) Rule)
Suppose an experiment has \(N\) possible outcomes, all equally likely. An event that can occur in \(f\) ways has a probability of \(f/N\) of occurring:
Important Principles and Notation for Probability
\(P\) denotes probability.
\(A\), \(B\), and \(C\) denote specific events.
\(P(A)\) denotes the probability of event \(A\) occurring, which is the fraction of times you expect to see event \(A\) in many trials.
Probabilities are numbers between 0 and 1, inclusive:
0 indicates an impossible event.
1 indicates a certain event.
Example 3.1 (Simple Examples of Probability)
Some simple examples of probability using the given definition:
a. Tossing a Coin: When tossing a coin, there are two possible outcomes: heads or tails. Since each side of the coin is equally likely to land face up, the probability of getting heads (or tails) is 1 out of 2, or 50%. This is because there is one favorable outcome (either heads or tails) and two possible outcomes in total.
Sample space, \(S\): {Heads (H), Tails (T)}
Number of possible outcomes, \(N\): 2
Event \(E\): Getting a Heads (H)
Number of favorable outcomes, \(f\): 1
Probability of getting a Heads:
b. Rolling a Die: Rolling a die presents six possible outcomes, one for each face of the die showing numbers 1 through 6. If we’re interested in the probability of rolling a 4, there is only one favorable outcome (rolling a 4) out of the six possible outcomes. Therefore, the probability of rolling a 4 is 1 out of 6, or approximately 16.67%.
Sample space, \(S\): {1, 2, 3, 4, 5, 6}
Number of possible outcomes, \(N\): 6
Event \(E\): Rolling a 4
Number of favorable outcomes, \(f\): 1
Probability of rolling a 4:
c. Drawing a Card from a Deck: In a standard deck of 52 playing cards, there are four Aces. If we want to calculate the probability of drawing an Ace from a full deck, we have four favorable outcomes (the Aces) and 52 possible outcomes in total. This gives us a probability of 4 out of 52, which simplifies to 1 out of 13, or approximately 7.69%.
Sample space, \(S\): 52 cards
Number of possible outcomes, \(N\): 52
Event \(E\): Drawing an Ace
Number of favorable outcomes, \(f\): 4 (one Ace from each suit)
Probability of drawing an Ace:
d. Picking a Red Marble from a Bag: Consider a bag containing 10 marbles, 6 of which are red and 4 are blue. If we want to find the probability of picking a red marble, we have six favorable outcomes (the red marbles) out of ten possible outcomes. The probability of picking a red marble is therefore 6 out of 10, which simplifies to 3 out of 5, or 60%.
Sample space, \(S\): 10 marbles (6 red, 4 blue)
Number of possible outcomes, \(N\): 10
Event \(E\): Picking a red marble
Number of favorable outcomes, \(f\): 6
Probability of picking a red marble:
e. Selecting a Day of the Week: There are seven days in a week. If we define the weekend as Saturday and Sunday, then there are two favorable outcomes (Saturday and Sunday) out of the seven possible outcomes (the days of the week). The probability of selecting a weekend day is 2 out of 7, or approximately 28.57%.
Sample space, \(S\): {Monday, Tuesday, Wednesday, Thursday, Friday, Saturday, Sunday}
Number of possible outcomes, \(N\): 7
Event \(E\): Selecting a weekend day (Saturday or Sunday)
Number of favorable outcomes, \(f\): 2
Probability of selecting a weekend day:
Example 3.2 (Probability with Two Dice)
When two fair six-sided dice are rolled, there are 36 equally likely outcomes. Calculate the probability that:
a. The sum of the dice is 7.
b. At least one die shows a number greater than 4.
Solution: The grid in Fig. 3.3 visually represents all possible outcomes when rolling two dice. Each cell corresponds to a unique combination of dice rolls, making it easier to count favorable outcomes for various scenarios.
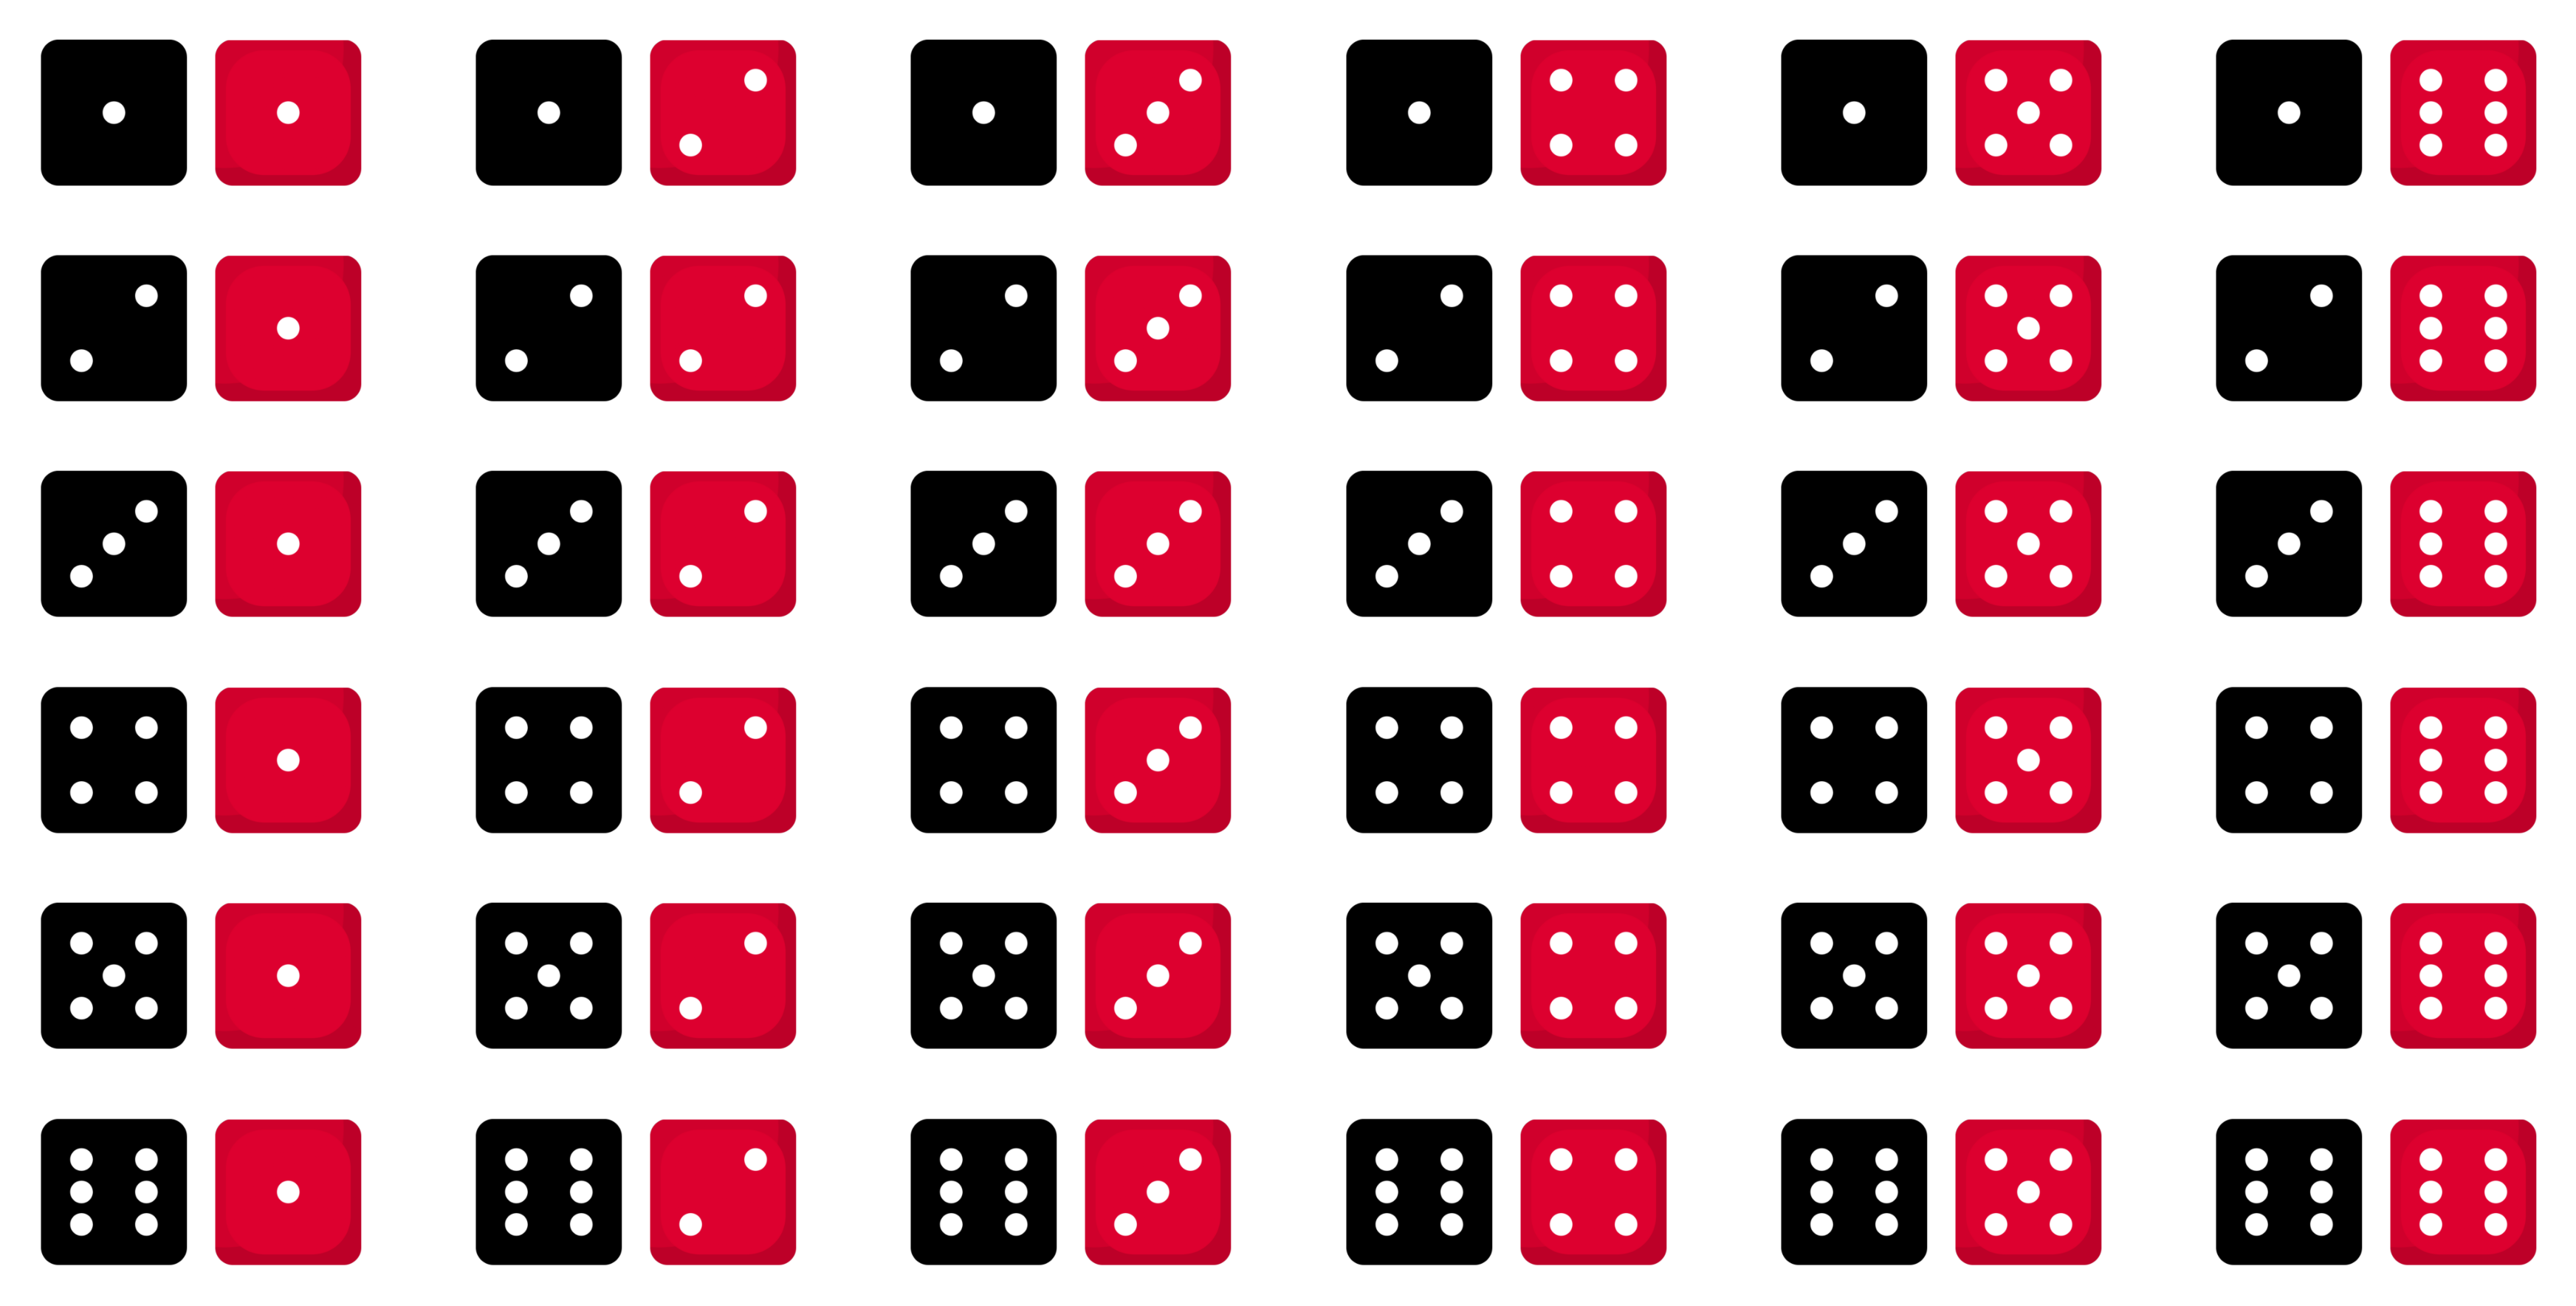
Fig. 3.3 Visualization of all possible outcomes when rolling two dice. Each cell represents a unique combination of dice rolls.#
a. The sum is 7: The possible outcomes that result in a sum of 7 are (1,6), (2,5), (3,4), (4,3), (5,2), and (6,1). There are 6 favorable outcomes out of 36 total outcomes.
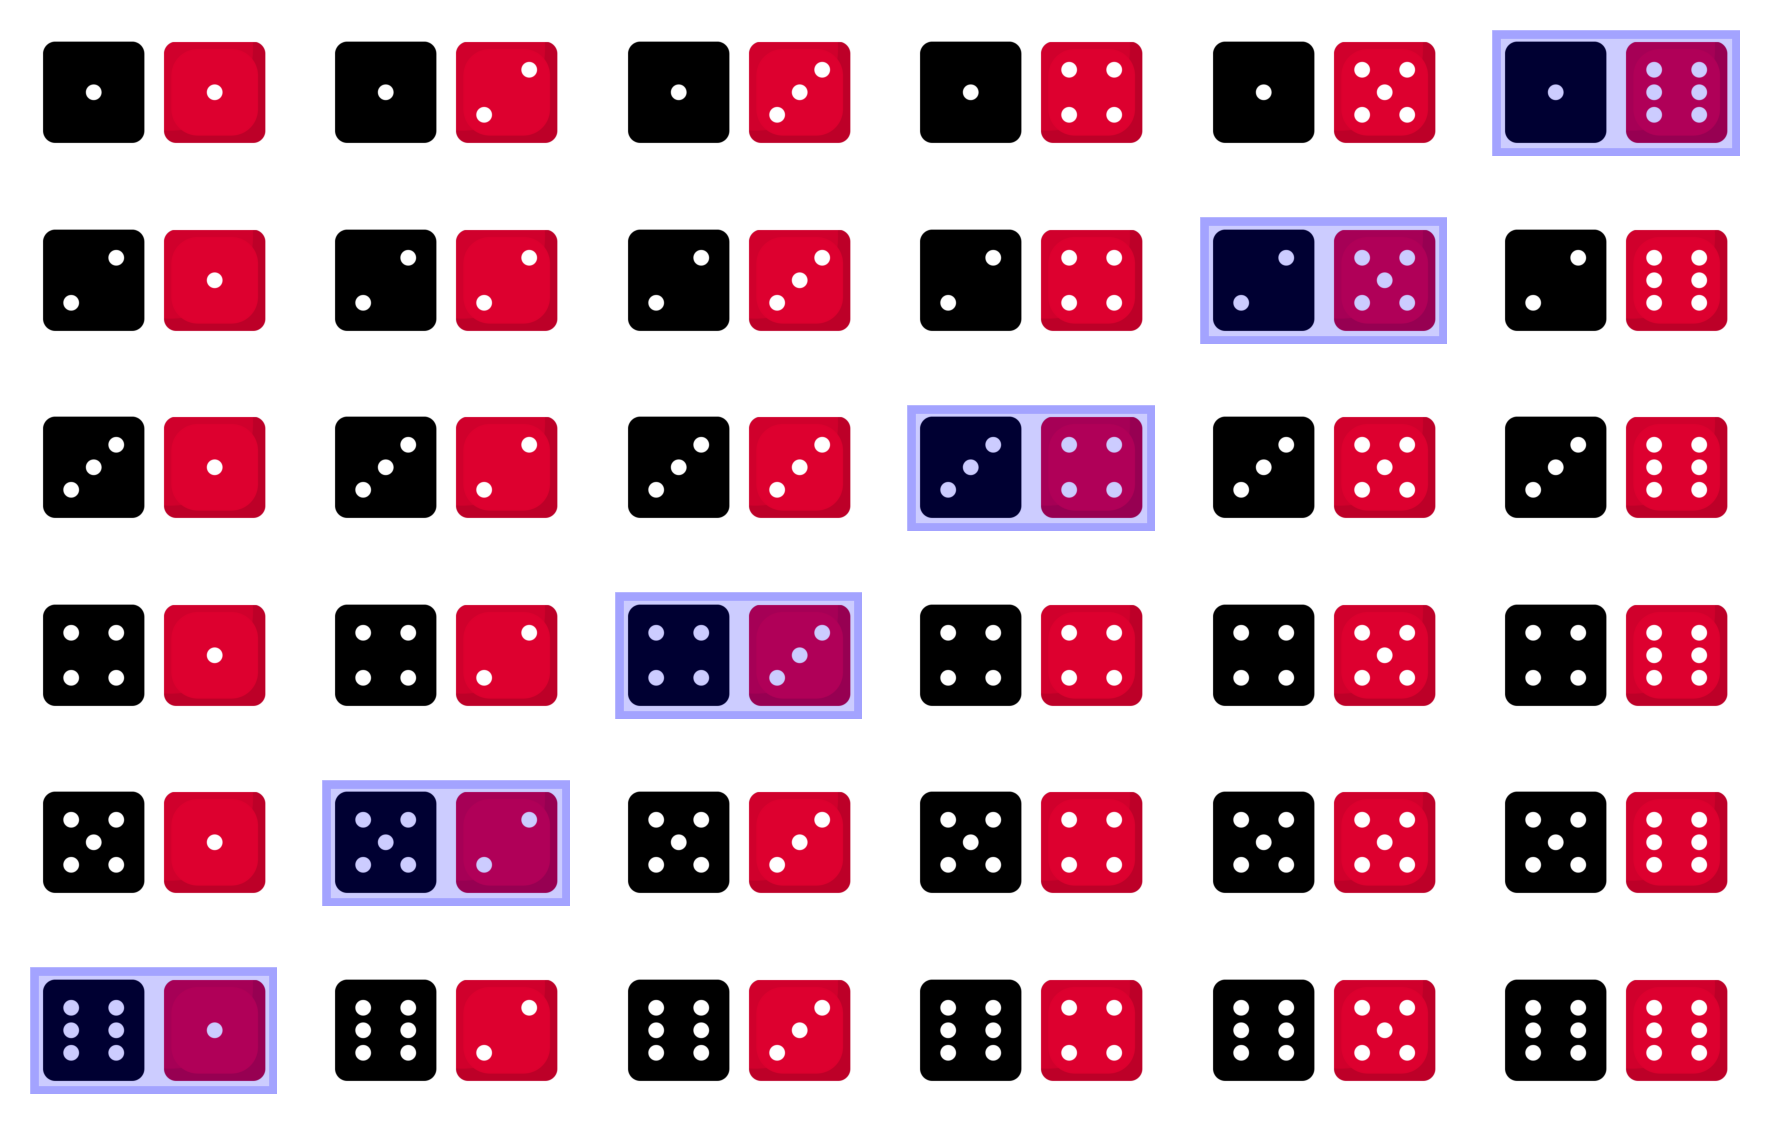
Fig. 3.4 Visualization of outcomes where the sum is 7 (highlighted in blue).#
b. At least one die shows a number greater than 4: The favorable outcomes are when at least one die shows a 5 or 6. This includes:
All outcomes where the first die is 5 or 6: (5,1), (5,2), (5,3), (5,4), (5,5), (5,6), (6,1), (6,2), (6,3), (6,4), (6,5), (6,6)
Outcomes where the first die is 1-4 and the second die is 5 or 6: (1,5), (1,6), (2,5), (2,6), (3,5), (3,6), (4,5), (4,6)
There are 20 favorable outcomes out of 36 total outcomes.
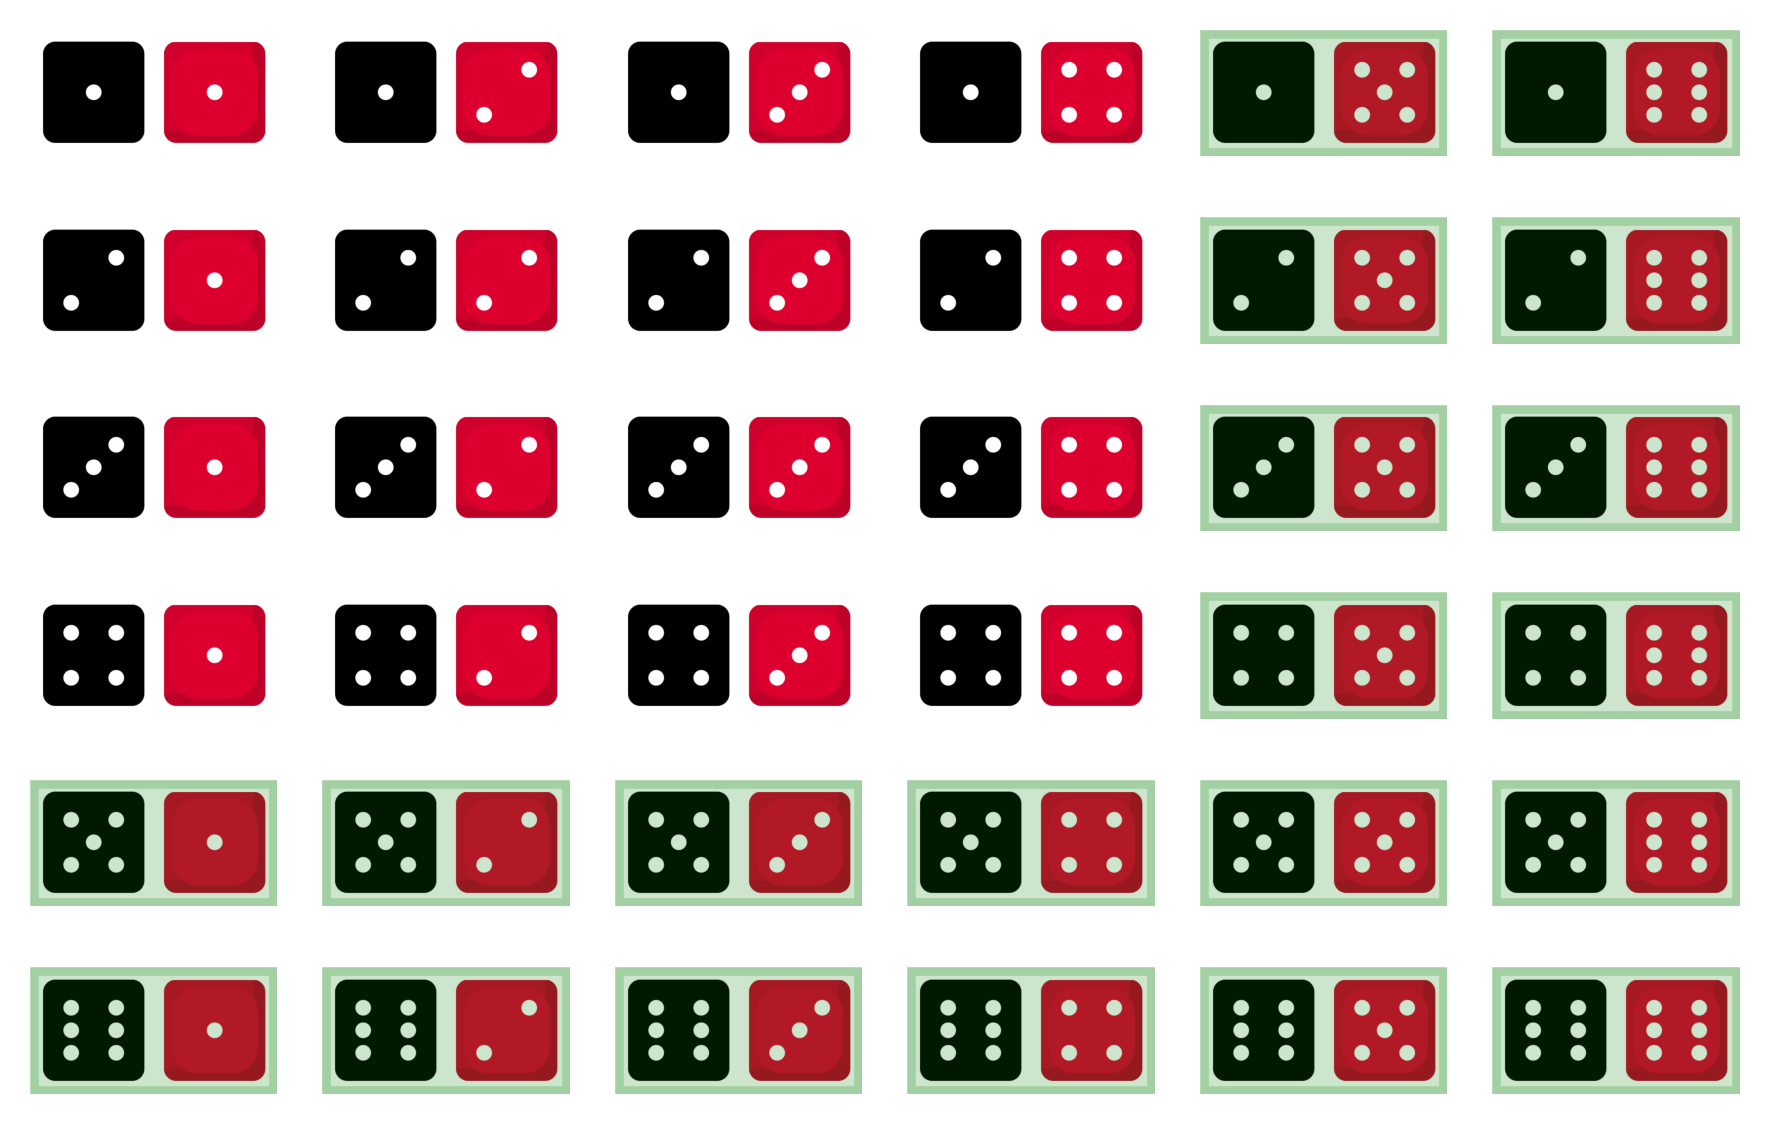
Fig. 3.5 Visualization of outcomes where at least one die shows a number greater than 4 (highlighted in green).#
These calculations show that the probability of rolling a sum of 7 is 1/6 (approximately 16.67%), and the probability of having at least one die greater than 4 is 5/9 (approximately 55.56%).
Example 3.3 (Probability with Two Dice)
When two fair six-sided dice are rolled, there are 36 equally likely outcomes. Calculate the probability that:
a. The sum of the dice is exactly 9.
b. At least one die shows a number less than 3.
Solution: The grid in Fig. 3.6 visually represents all possible outcomes when rolling two dice. Each cell corresponds to a unique combination of dice rolls, making it easier to count favorable outcomes for various scenarios.

Fig. 3.6 Visualization of all possible outcomes when rolling two dice. Each cell represents a unique combination of dice rolls.#
a. The sum is exactly 9: The possible outcomes that result in a sum of 9 are (3,6), (4,5), (5,4), and (6,3). There are 4 favorable outcomes out of 36 total outcomes.
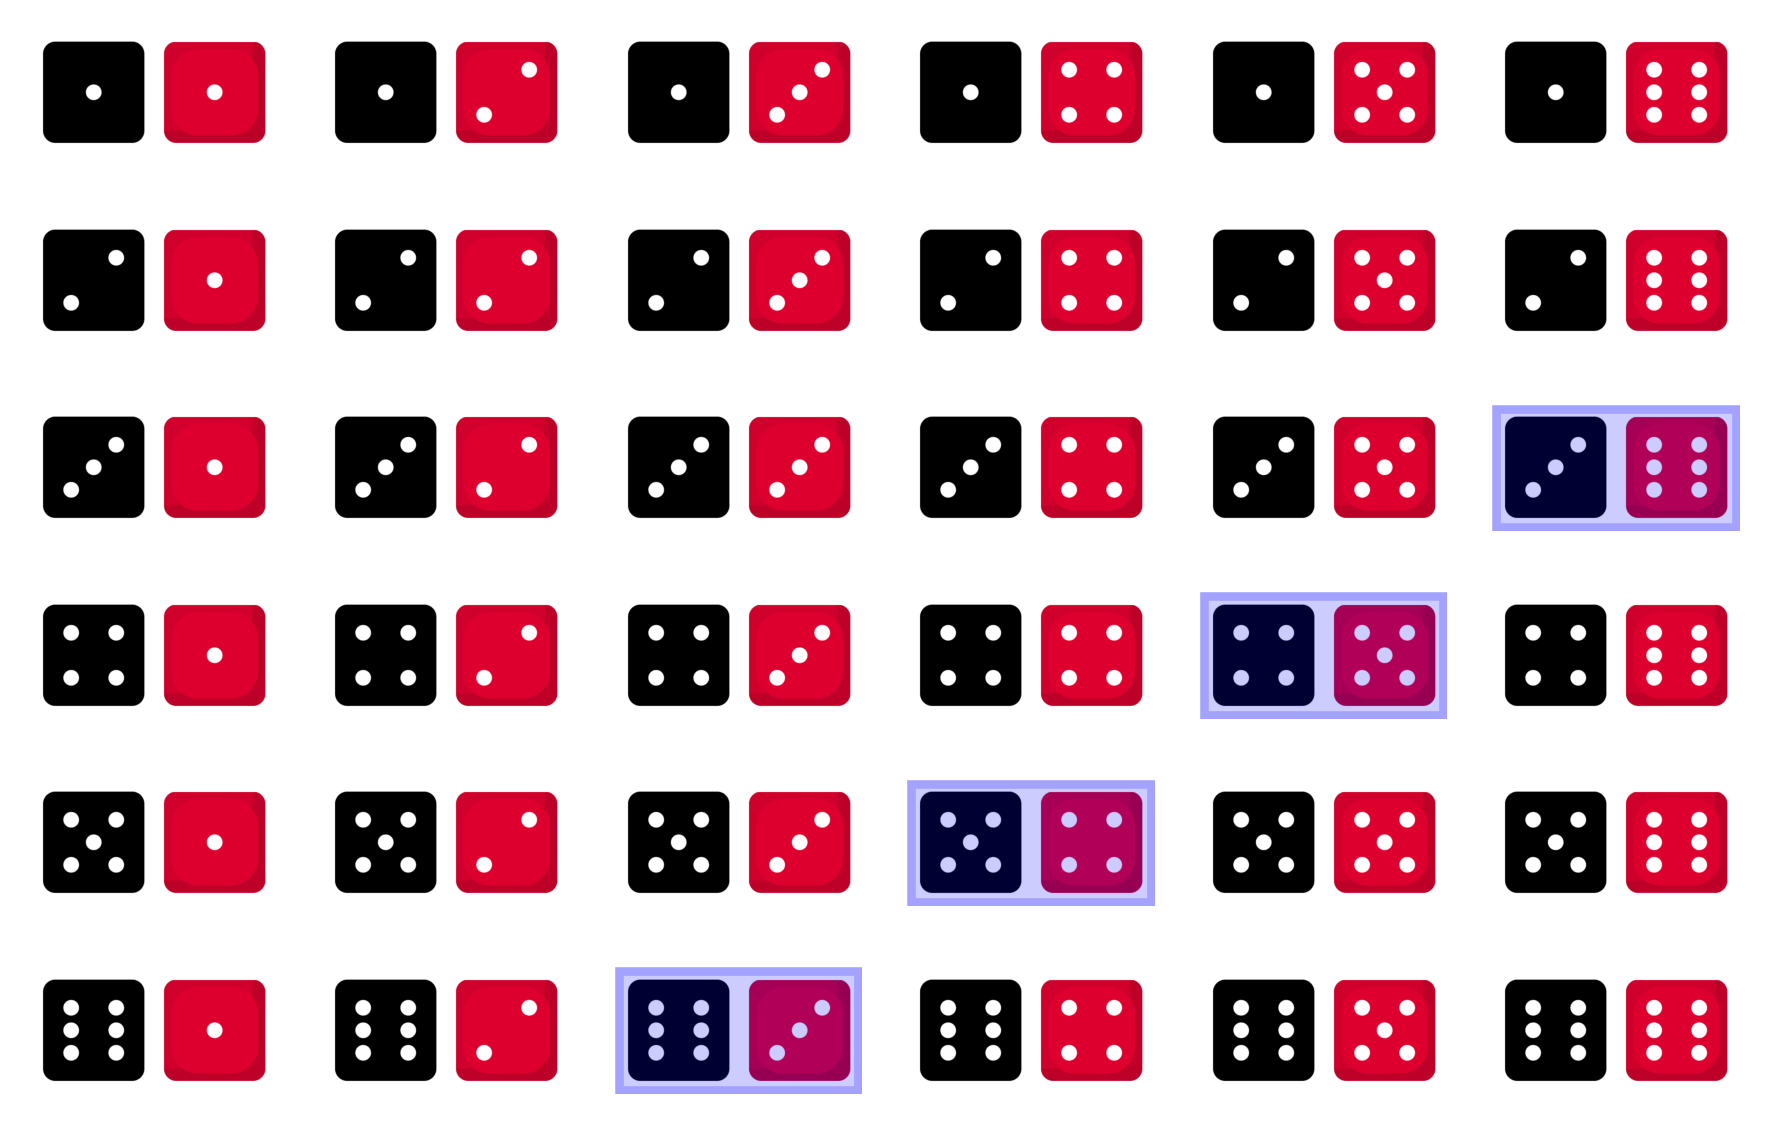
Fig. 3.7 Visualization of outcomes where the sum is exactly 9 (highlighted in blue).#
b. At least one die shows a number less than 3: The favorable outcomes are when at least one die shows a 1 or 2. This includes:
All outcomes where the first die is 1 or 2: (1,1), (1,2), (1,3), (1,4), (1,5), (1,6), (2,1), (2,2), (2,3), (2,4), (2,5), (2,6)
Outcomes where the first die is 3-6 and the second die is 1 or 2: (3,1), (3,2), (4,1), (4,2), (5,1), (5,2), (6,1), (6,2)
There are 20 favorable outcomes out of 36 total outcomes.
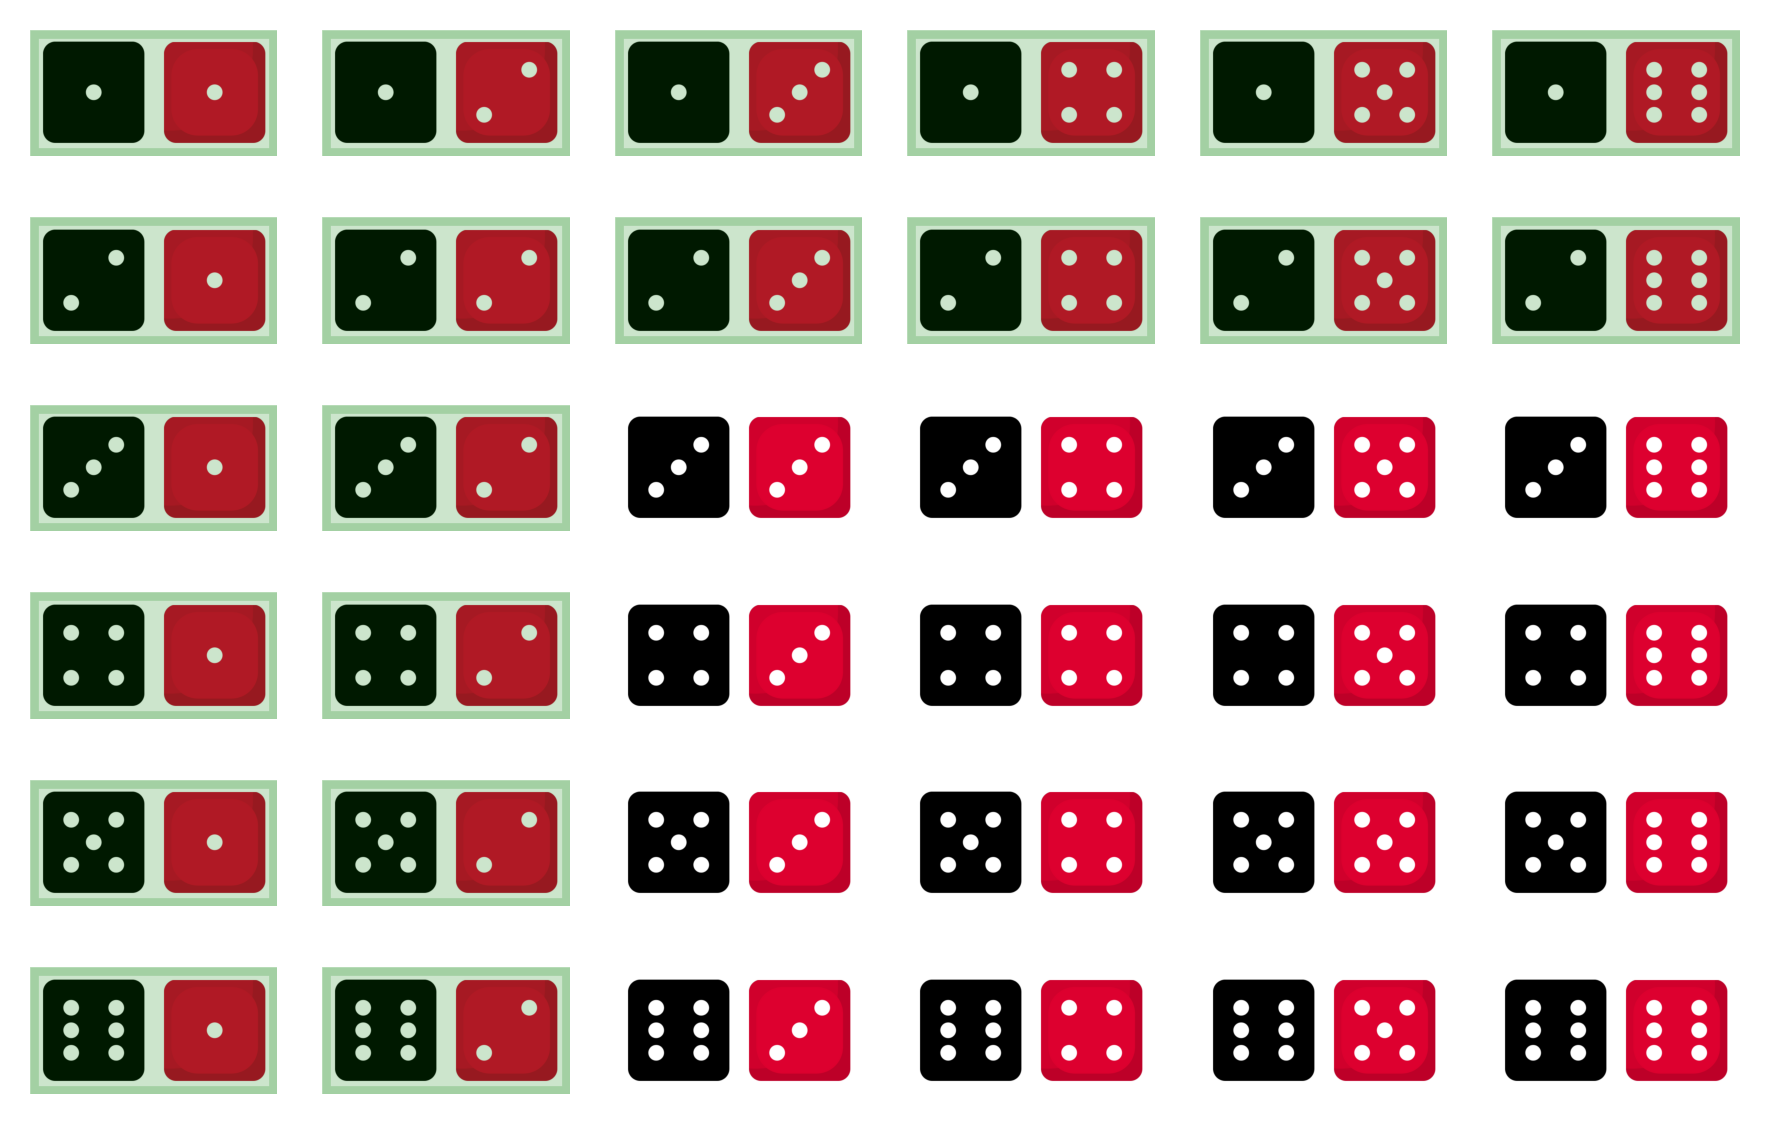
Fig. 3.8 Visualization of outcomes where at least one die shows a number less than 3 (highlighted in green).#
These calculations show that the probability of rolling a sum of 9 is 1/9 (approximately 11.11%), and the probability of having at least one die less than 3 is 5/9 (approximately 55.56%).
Example 3.4 (Probability with Playing Cards)
A standard deck of playing cards has 52 cards, divided into 4 suits of 13 cards each (hearts, diamonds, clubs, and spades). Each suit has an Ace, numbers 2 through 10, and three face cards: Jack, Queen, and King. Calculate the probability that:
a. A card drawn is an Ace.
b. A card drawn is a red card (hearts or diamonds).
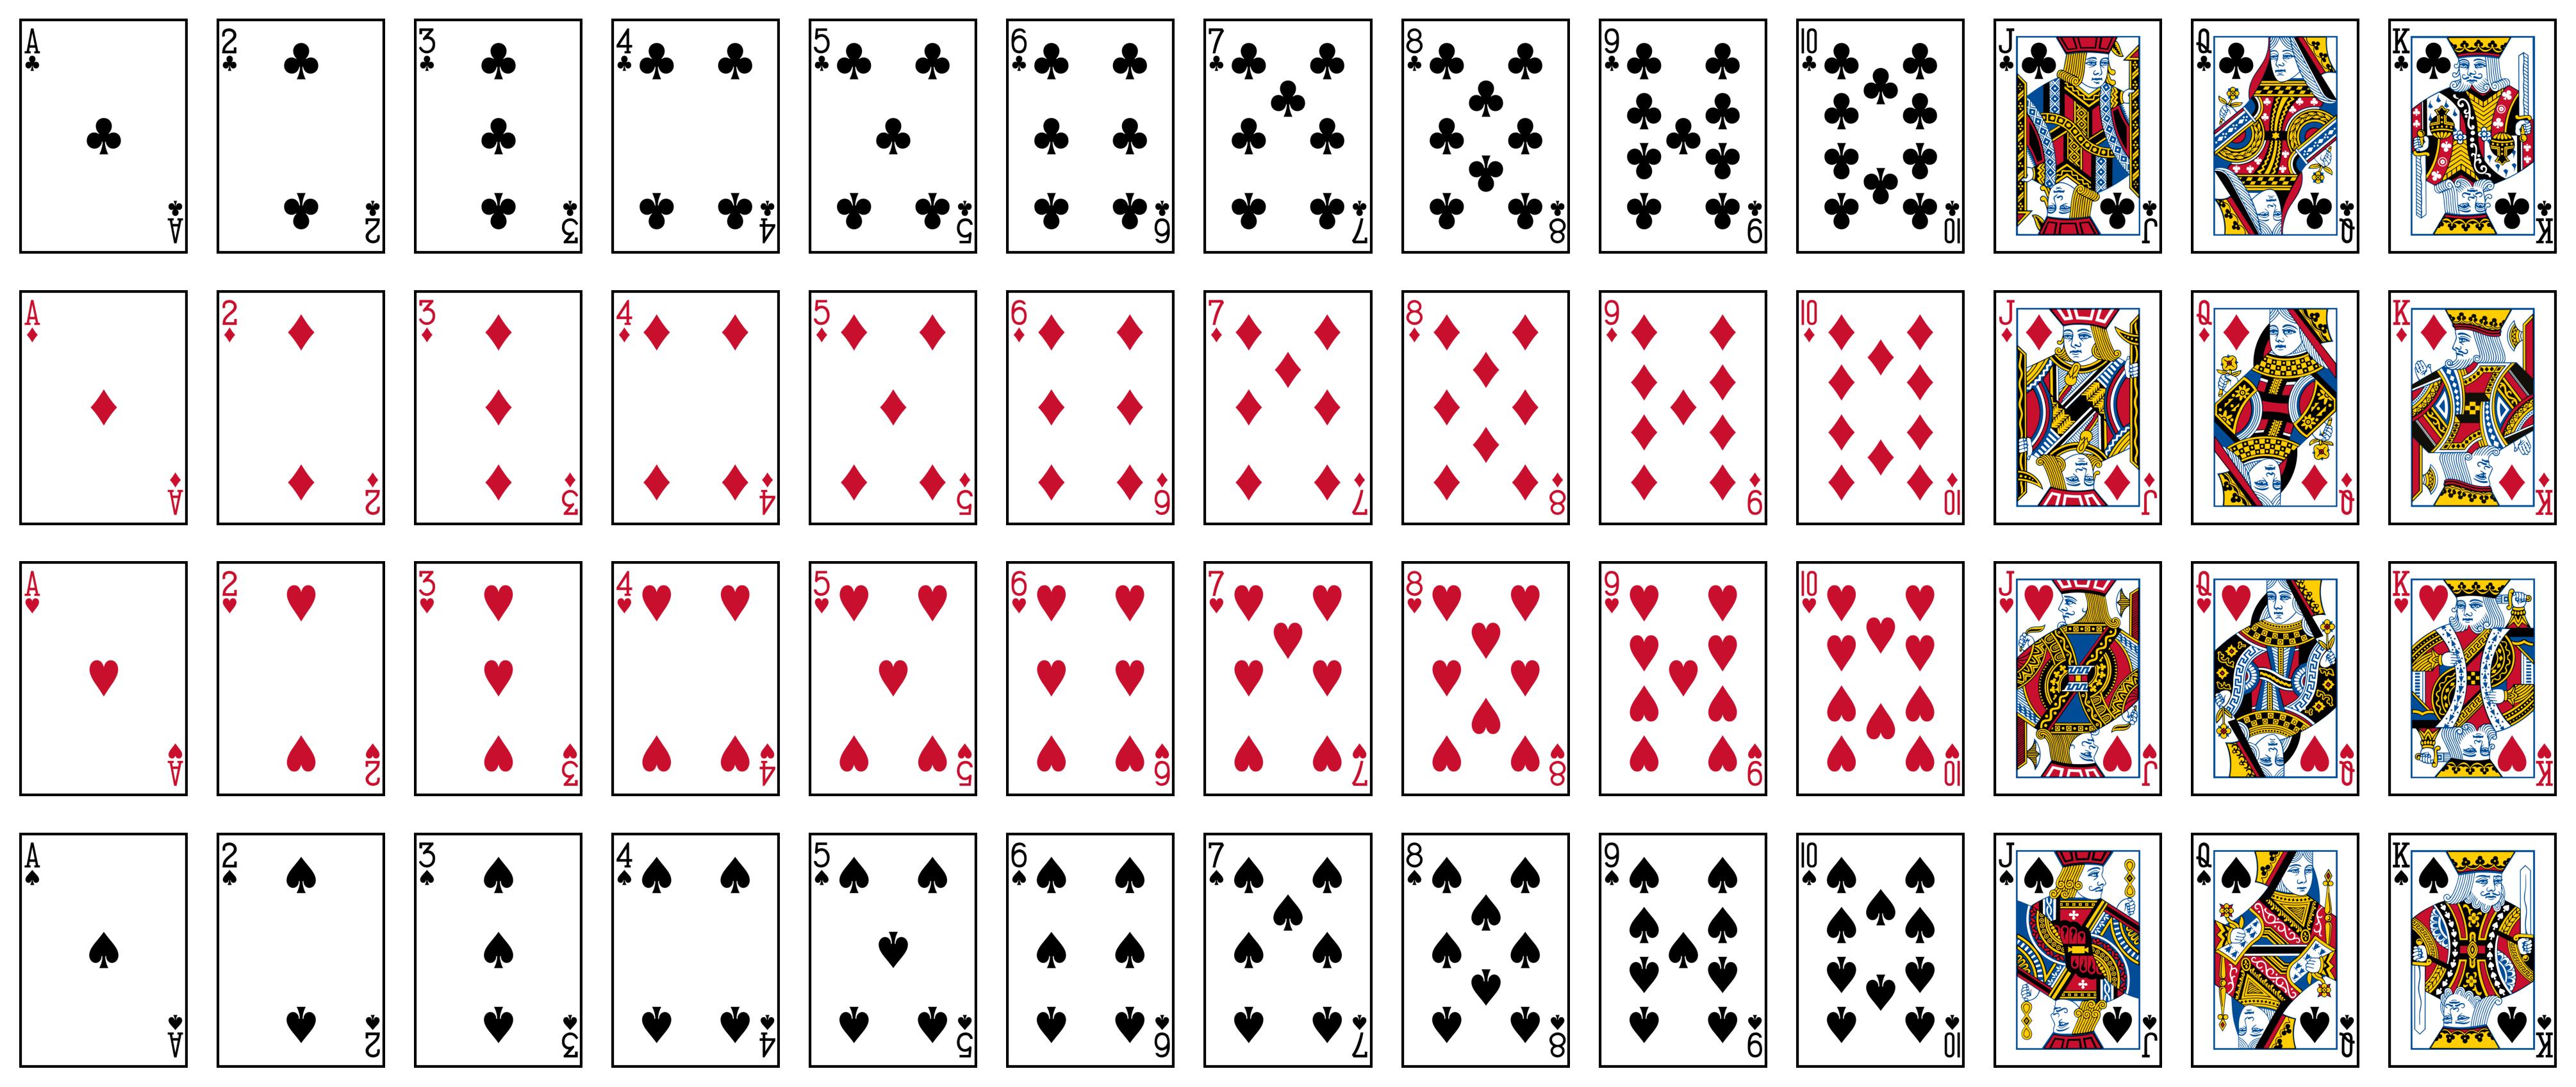
Fig. 3.9 A standard deck of playing cards. Image generated based on this source.#
Solution:
a. Drawing an Ace: There are 4 Aces in a standard deck of 52 cards.
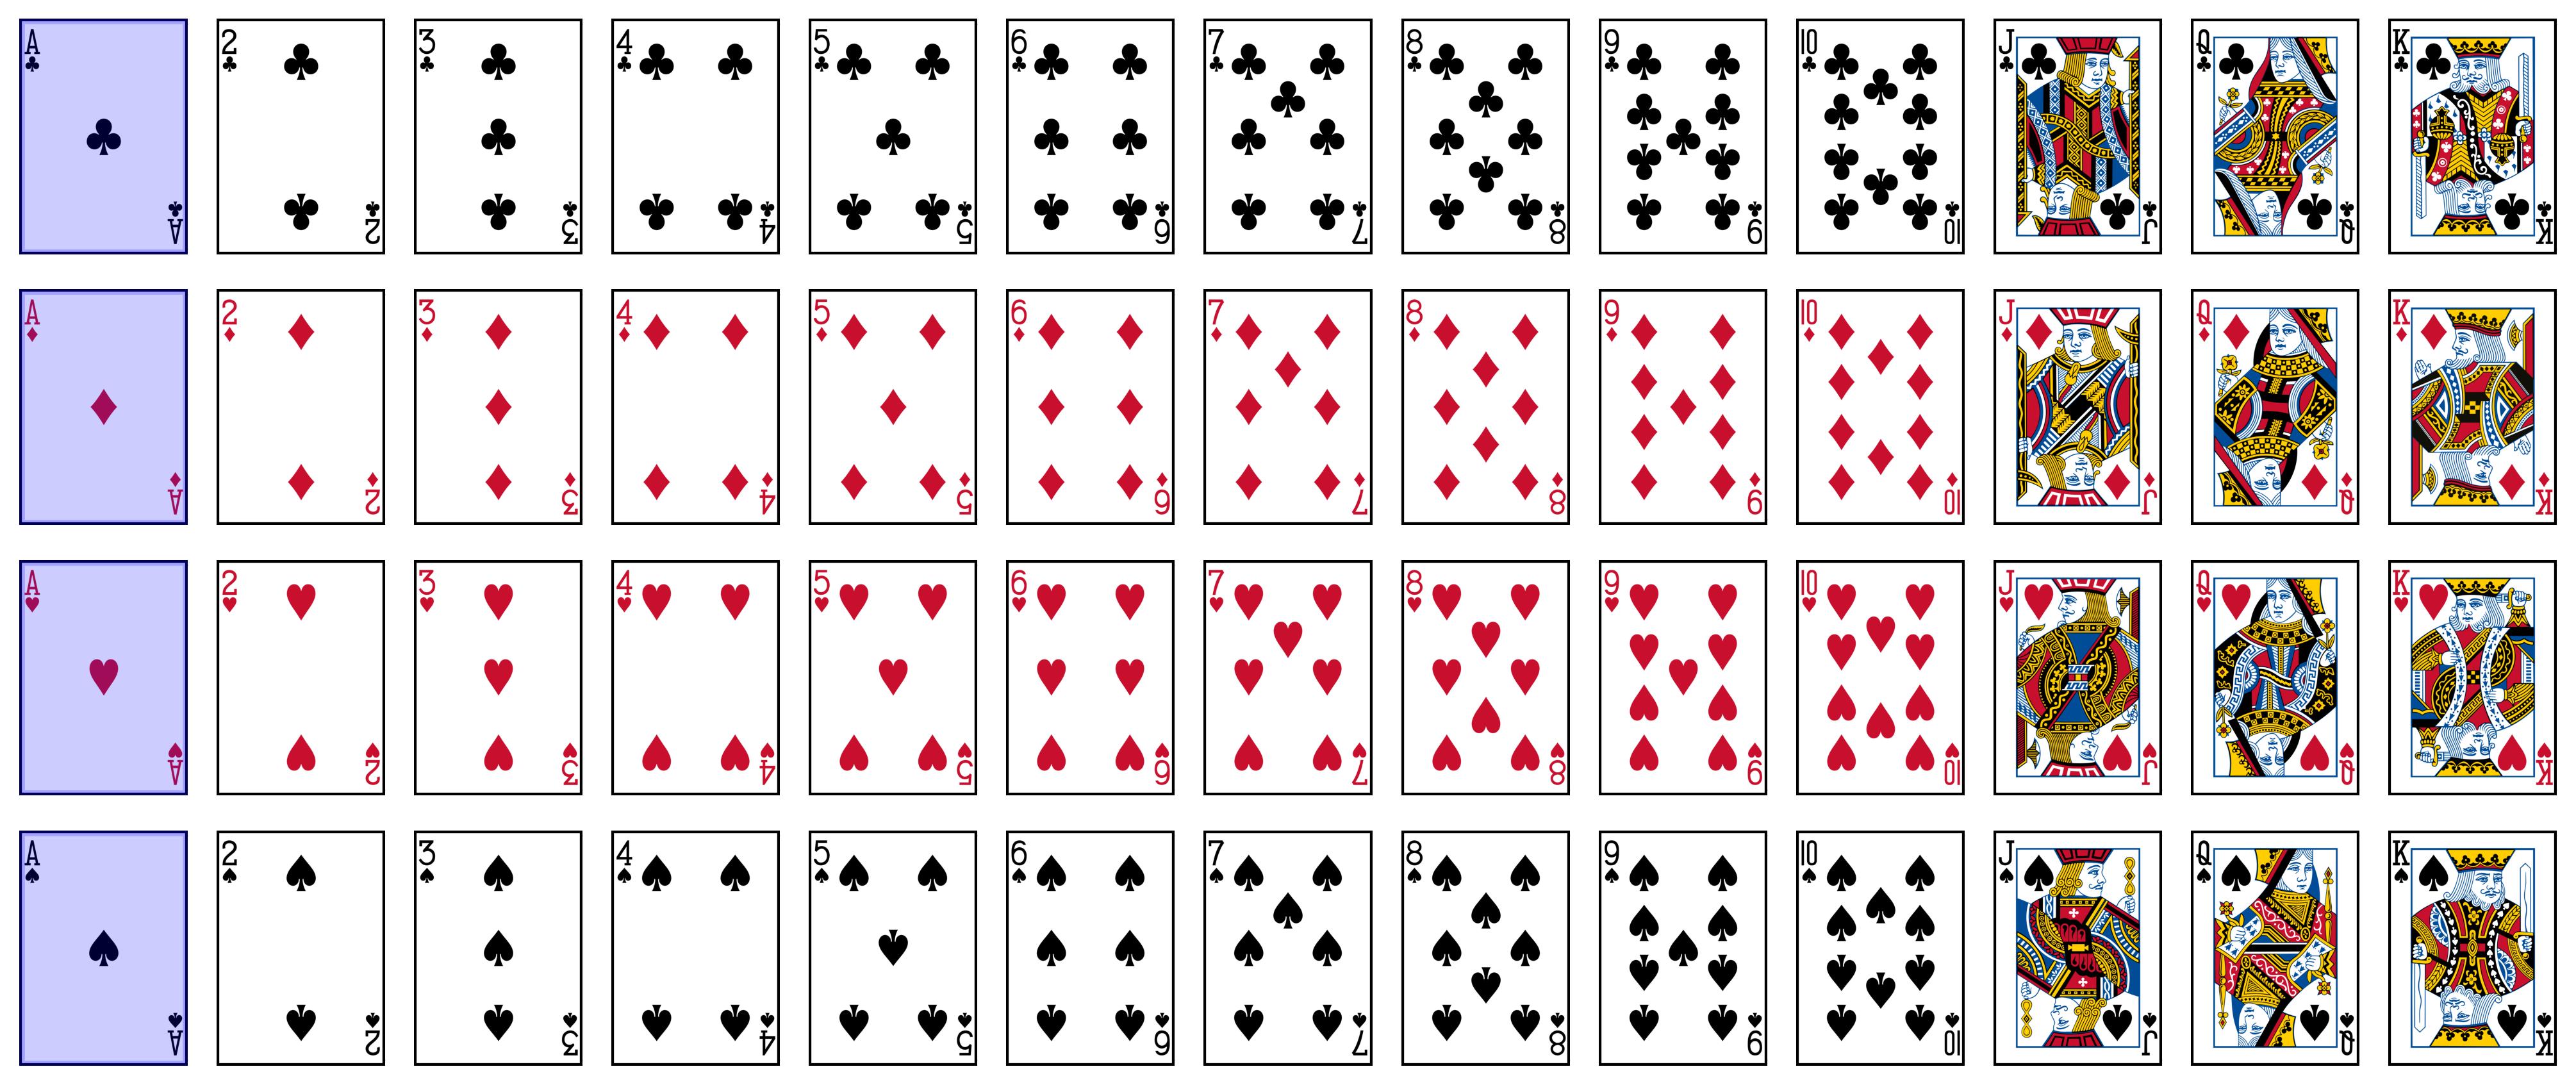
Fig. 3.10 Highlighted Aces in the deck.#
b. Drawing a red card: There are 26 red cards in a deck (13 hearts + 13 diamonds).
These calculations show that the probability of drawing an Ace is \(\frac{1}{13}\), and the probability of drawing a red card is \(\frac{1}{2}\).
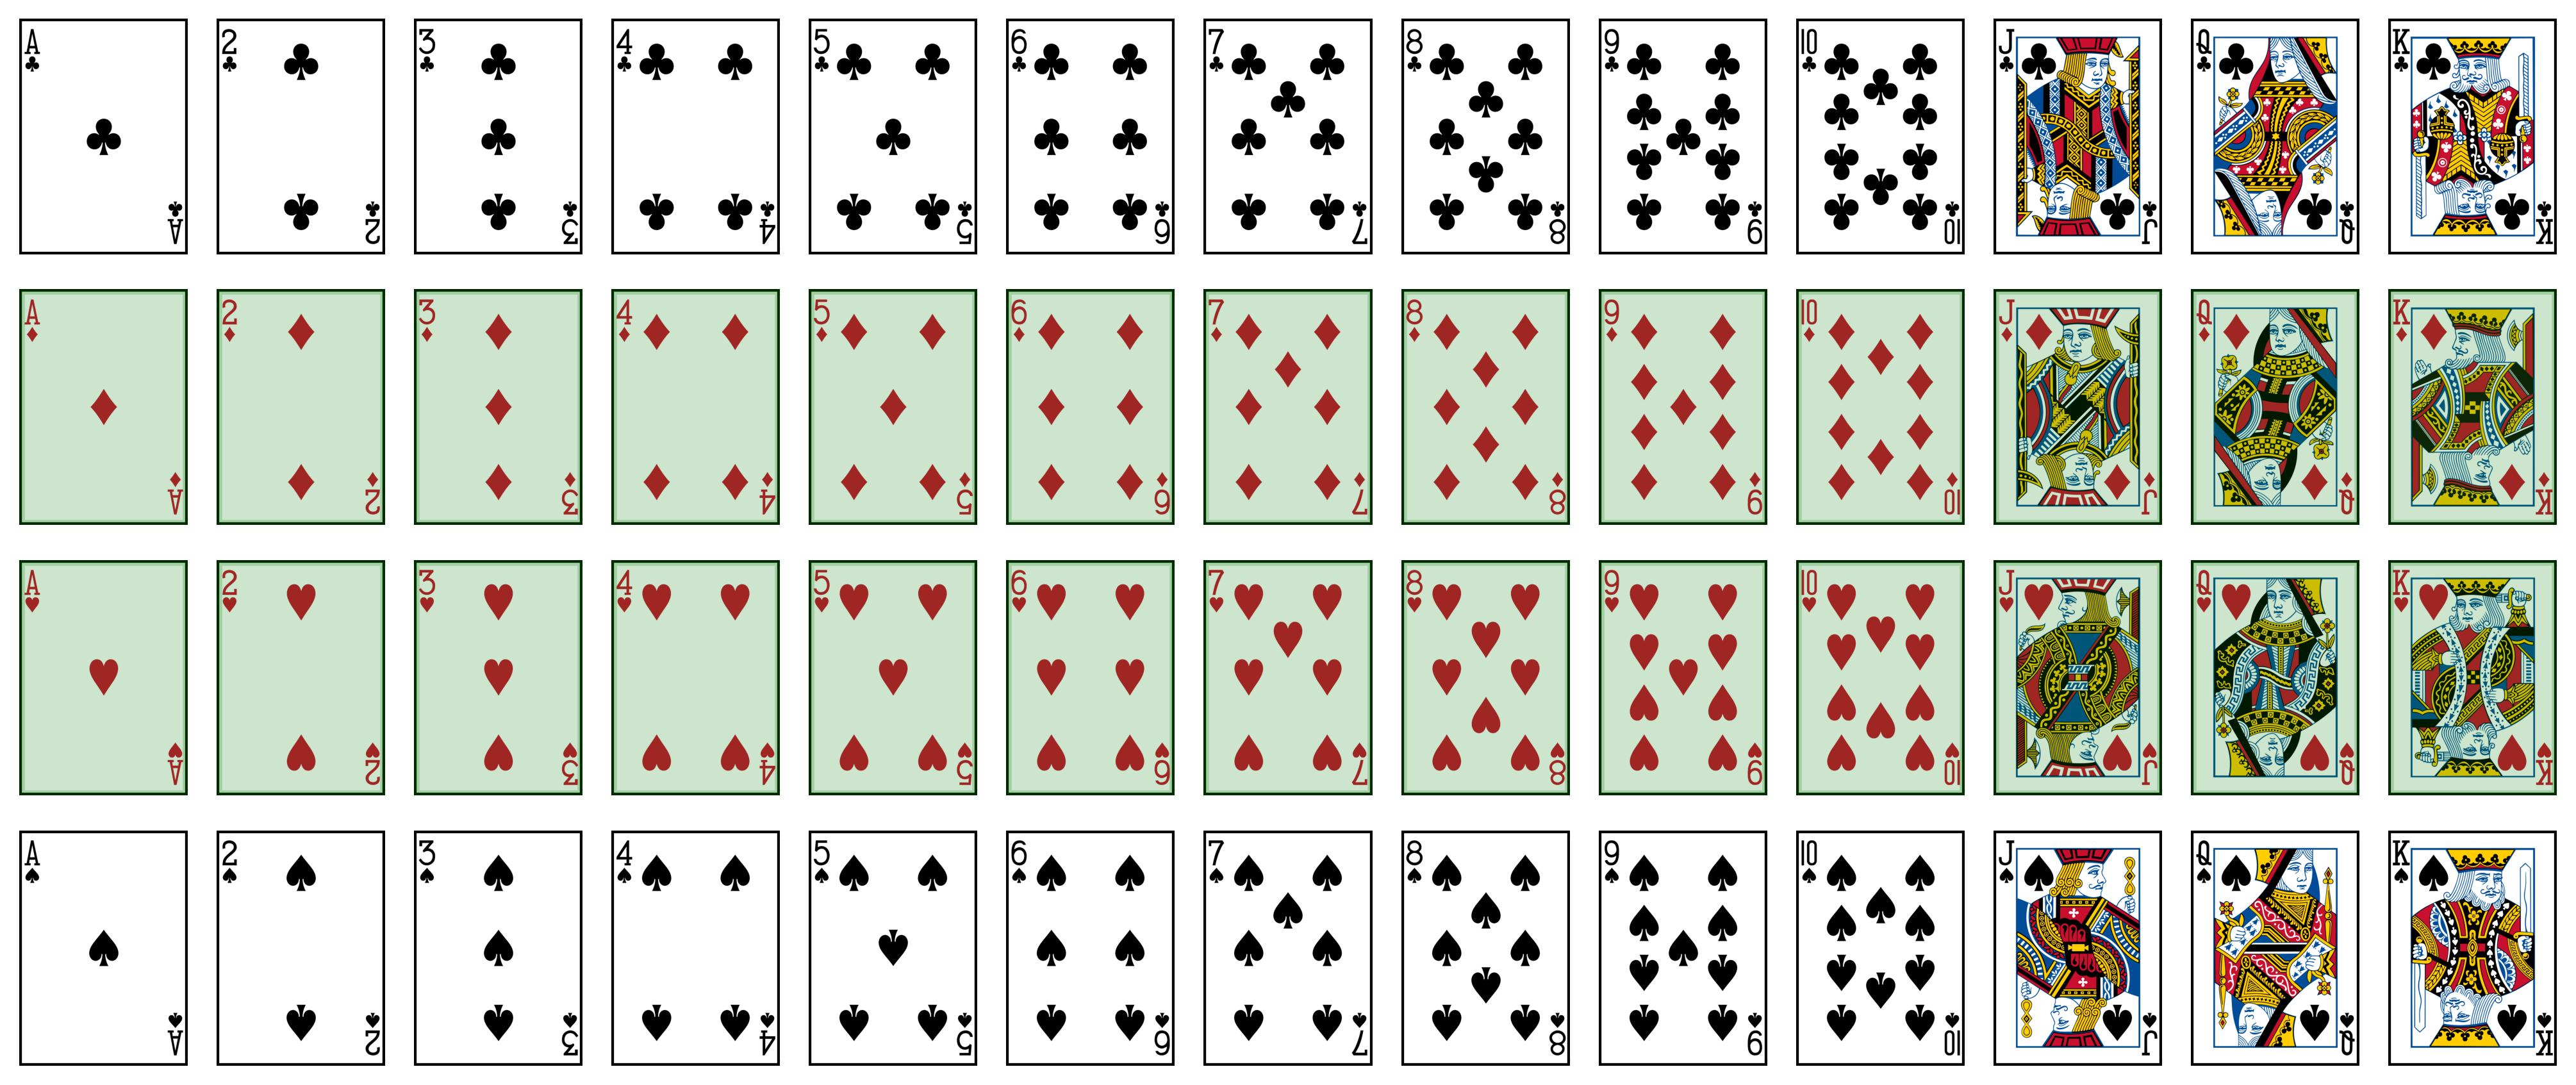
Fig. 3.11 Highlighted red cards in the deck.#
