1.2. Quantitative and Qualitative Variables#
Definition - Quantitative and Qualitative Variables
In statistics, quantitative variables are variables that represent numerical values or counts that indicate the amount or quantity of something. For example, the height, weight, and age of a sample of patients are quantitative variables that measure their physical characteristics [Agresti et al., 2022, Triola, 2007].
Qualitative variables are variables that represent non-numerical categories or groups that describe the attributes or qualities of something. For example, the medical diagnosis or the ethnic group of an individual are qualitative variables that indicate their health status or cultural identity [Agresti et al., 2022, Triola, 2007].
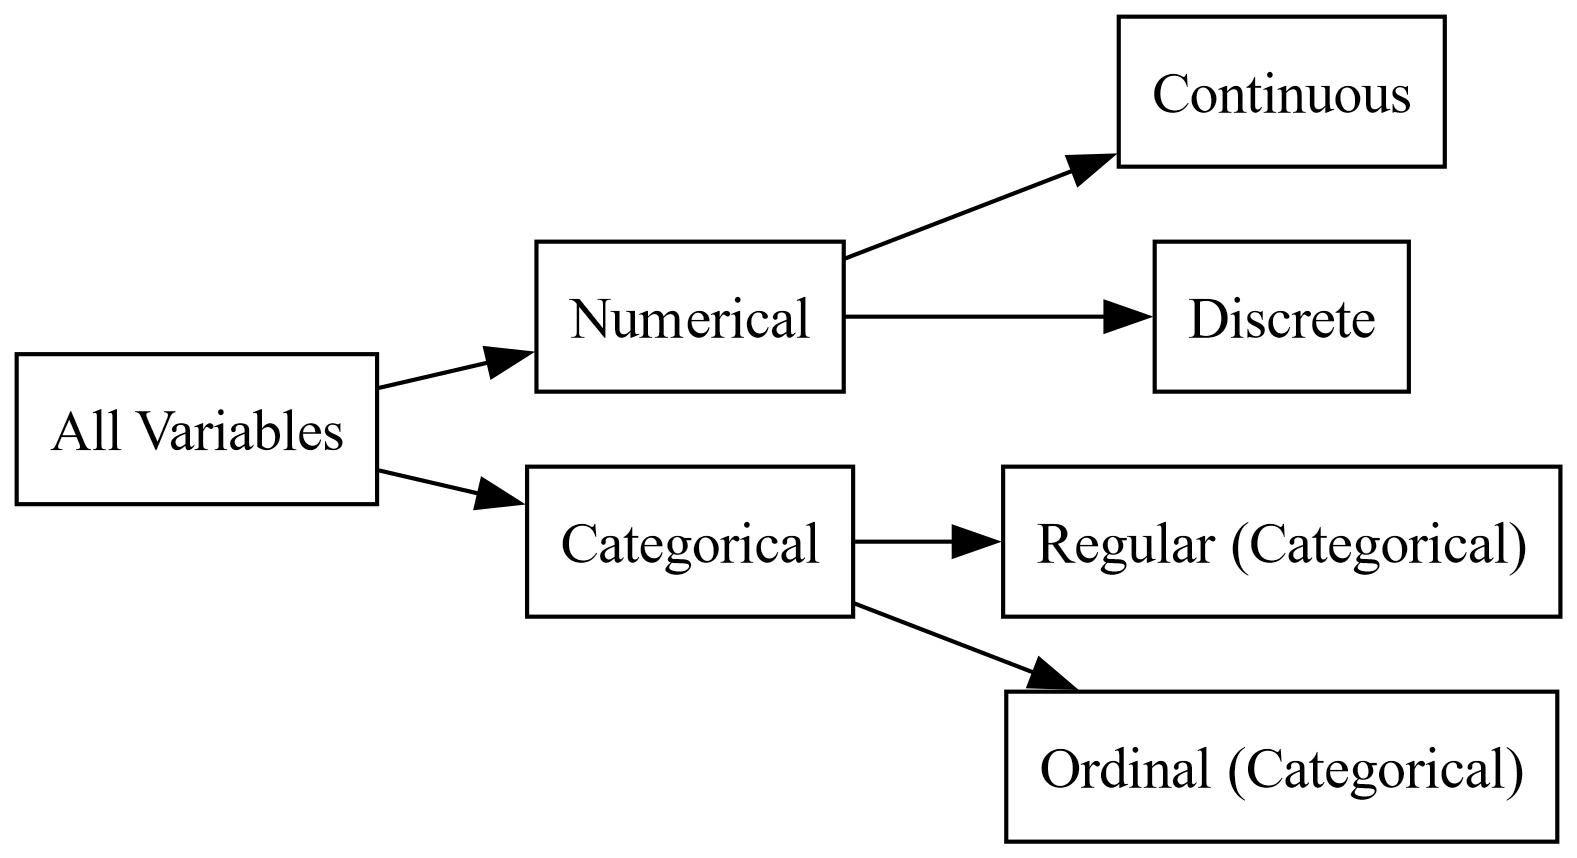
Fig. 1.2 is a flowchart that categorizes variables into different types:
All Variables: The starting point of the flowchart.
Numerical: Divided into two subcategories:
Continuous: Variables that can take any value within a range.
Discrete: Variables that can only take specific values.
Categorical: Divided into two subcategories:
Regular (Categorical): Variables that represent categories without any order.
Ordinal (Categorical): Variables that represent categories with a specific order.
This flowchart helps in understanding how variables are classified based on their characteristics, which is essential in statistical analysis and data science.

Fig. 1.2 Quantitative (numerical) and qualitative (categorical) variables.#
Definition - Discrete and Continuous Data
In statistics, discrete and continuous data are two types of numerical data that can be analyzed using statistical methods. Discrete data consist of values that can only take certain fixed points, usually integers, counts, or categories. Examples of discrete data are the number of students in a class, the result of a coin toss, or the blood type of a person [Agresti et al., 2022, Triola, 2007].
Example 1.8
Consider discrete data as exemplified by countable entities like the number of students in a class, the color of a car, or the type of coin. These discrete datasets consist of distinct, separate values. Conversely, continuous data can assume any value within a range, accommodating fractions, decimals, or precise measurements. Illustrative examples encompass the height of a person, the weight of a fruit, or the temperature of a room. The continuous nature of such data allows for an unbroken spectrum of possible values.
Example 1.9
Consider the following dataset.
age |
income |
transportation |
leisure_hours |
|---|---|---|---|
28 |
60000 |
car |
10 |
35 |
80000 |
public transit |
15 |
42 |
90000 |
bicycle |
8 |
29 |
75000 |
car |
12 |
48 |
110000 |
walking |
5 |
34 |
70000 |
public transit |
20 |
In this dataset,
age: Numerical, continuous
income: Numerical, continuous
transportation: Categorical
leisure_hours: Numerical, discrete
Remark
In the context of a dataset, the formal terms employed to characterize a row are either a “case” or an “observational unit.” Put differently, each row in the dataset signifies a distinctive case or individual observational unit that has been meticulously recorded or observed. This terminology underscores the individualized nature of each entry within the dataset, contributing to the comprehensive representation of the observed phenomena.
