Remark
Please be aware that these lecture notes are accessible online in an ‘early access’ format. They are actively being developed, and certain sections will be further enriched to provide a comprehensive understanding of the subject matter.
1.1. What are Time Series?#
1.1.1. What are Time Series?#
A time series is a sequence of data points indexed in chronological order. Most commonly, these points are recorded at regular intervals, forming a discrete-time sequence. Each observation represents the state of a variable (or variables) at a specific moment, making the temporal order an essential part of the data’s meaning.
Time series differ from other data types in that reordering the observations changes their interpretation. Measurements close in time are often more related than those farther apart, a property known as temporal dependence or autocorrelation. In many modern applications, time series arrive as continuous data streams from sensors, instruments, or digital services, requiring specialized methods for storage, processing, and analysis. [Time series, 2025].
Example 1.1 (Microsoft)
Some of the most recognizable time series data include stock prices fluctuating over trading days, temperature measurements recorded hourly or daily, GDP growth rates measured quarterly, and heart rate monitoring through medical devices. The example below visualizes Microsoft’s (MSFT) closing stock prices over the last year—a modern illustration of time series in financial markets, showing both daily volatility and evolving market trends.
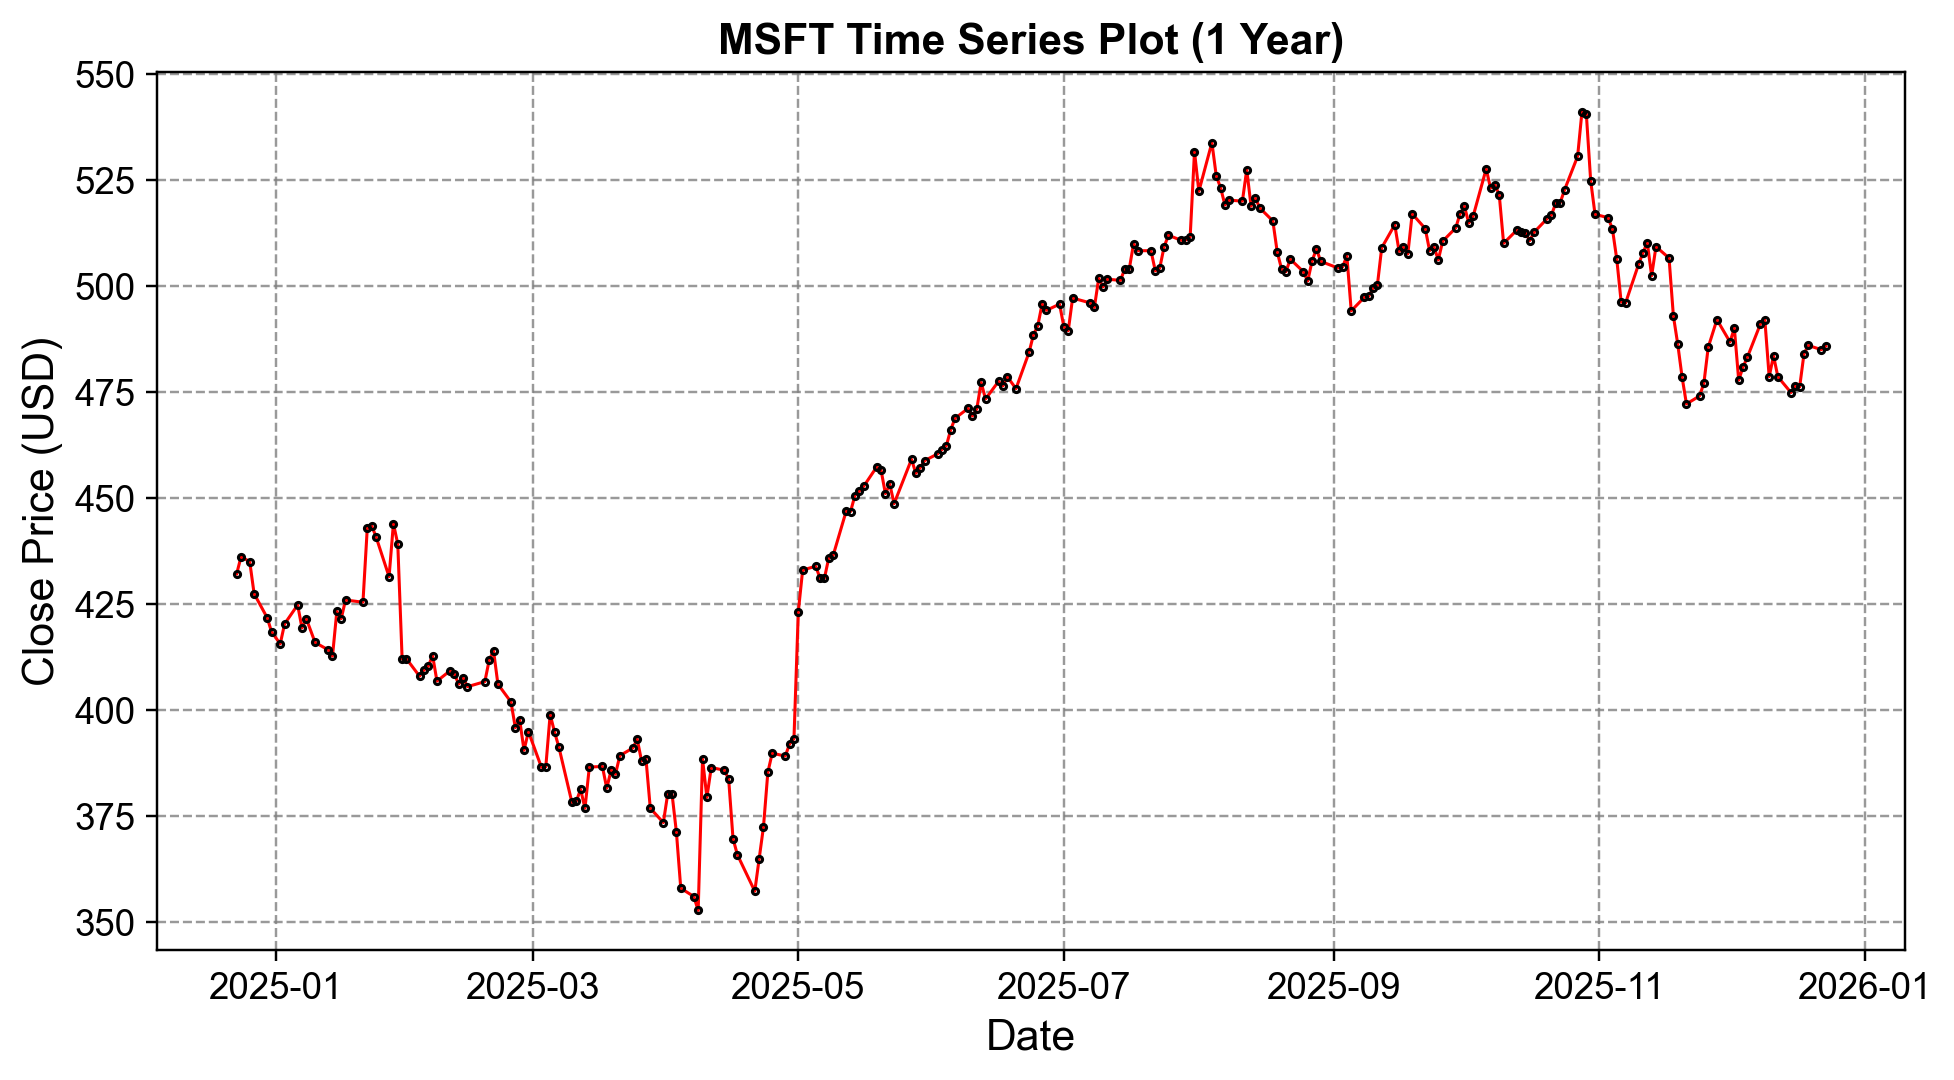
Fig. 1.1 Microsoft (MSFT) closing stock prices over the last year. Data source: Yahoo Finance, retrieved with yfinance.#
Time series data has several key characteristics that distinguish it from other types of data:
Temporal Ordering: Time series data has a natural temporal ordering that makes it distinct from cross-sectional studies where there is no natural ordering of observations. The timestamp associated with each data record serves as the key for computing or analysis. This ordering is fundamental—changing the sequence of observations fundamentally changes the nature of the data and the insights that can be drawn from it. Example: In climate monitoring, the sequence of daily temperature readings matters; if the order is shuffled, trends such as seasonal warming or cooling cannot be identified.
Sequential Nature: Observations close together in time tend to be more closely related than observations further apart. This temporal dependency is a fundamental property that influences analysis methods. For instance, today’s stock price is more likely to be similar to yesterday’s price than to the price from a year ago. This property, known as temporal autocorrelation, underlies many time series forecasting models. Example: In hydrology, river discharge on consecutive days is often correlated because upstream water levels change gradually over time.
Stream-like Properties: Time series data from connected devices can be thought of as continuous data streams, flowing into databases with high write/read ratios and immutable characteristics. Modern IoT deployments generate millions of sensor readings per second, creating unprecedented volumes of time series data that require specialized storage and processing approaches. Example: Smart electricity meters send second-by-second household energy consumption data to utility providers for real-time load balancing.
1.1.2. Time Series Formats#
Time series data extends far beyond classical tables—though numeric, timestamped records remain the most familiar form. At their core, time series are unified by their temporal sequence, but their modality and structure shape the required storage, analysis, and preprocessing methods. This overview examines the main time series formats with discussion of their analytical implications, preprocessing requirements, storage considerations, common software tools, and current advances including foundation models and unified AI approaches.
1.1.2.1. Traditional Numeric Series#
Tabular records associating each timestamp with one or more numeric measurements represent the most common time series format, widely used in finance, economics, science, and industrial monitoring. These series can be organized in several structural patterns.
Univariate series track a single variable over time, such as a stock’s daily closing price. Classical analysis approaches include ARIMA or exponential smoothing for forecasting, along with trend and seasonality extraction. Modern approaches leverage foundation models like TimesFM and Chronos for zero-shot forecasting, while transformer-based architectures enable long-term predictions. Preprocessing typically involves outlier detection, missing value imputation, and resampling to ensure consistent intervals. The R ecosystem provides robust tools through packages like forecast, tsibble, and fable, while Python offers pandas, statsmodels, prophet, sktime, and darts.
Multivariate series capture multiple related variables in each record, such as temperature, humidity, and wind speed measured simultaneously every hour. Classical analysis techniques include vector autoregression (VAR), multivariate state-space models, and anomaly detection. Modern transformer-based architectures can perform multivariate forecasting with foundation models incorporating cross-series attention mechanisms. The UCI Air Quality Dataset provides an excellent example, containing hourly readings of multiple pollutants and weather parameters.
Panel data or multiple independent series consist of structurally similar but separate time series, such as rainfall measurements across unrelated cities or sales data across many retail stores. Classical panel data regression, mixed-effects modeling, and cross-sectional comparison have been standard approaches. Modern foundation models trained on heterogeneous panels now enable universal forecasting across domains without task-specific training. The FRED-QD dataset exemplifies this structure, offering quarterly economic data for multiple U.S. regions maintained by the Federal Reserve Bank of St. Louis.
Storage format considerations are crucial for numeric time series. Wide format places each time series or variable in its own column, facilitating visualization, while long format uses a stacked structure with series and variable identifiers, offering more flexibility for modeling and aggregation. For high-frequency, long-span data, specialized time series databases like InfluxDB or TimescaleDB optimize time-indexed ingestion and querying. Columnar file formats such as Apache Parquet and Arrow provide efficient storage and analytics workloads, enabling fast retrieval and seamless integration with Python and R.
1.1.2.2. Event-Driven or Irregular Time Series#
Event-driven data represents time-stamped observations captured only when triggering events occur, as in system logs or security alerts. Unlike regularly sampled metrics, intervals between entries vary considerably. A security system might record motion detection only when movement occurs, or server logs might capture only errors and significant state changes rather than maintaining continuous monitoring.
Classical analysis approaches include point process modeling, event clustering, and survival analysis. Modern advances have introduced neural point processes, transformer-based event sequence modeling, and foundation models specifically designed for irregular time series. Preprocessing typically involves temporal normalization, deduplication, and event aggregation by interval. For real-time, at-scale applications, event streaming platforms like Apache Kafka and Apache Pulsar provide robust infrastructure for managing and distributing these streams across distributed systems.
1.1.2.3. Signal-Oriented Data (Audio, Biomedical, Sensor)#
Continuous or discrete signal measurements over time often require analysis in both time and frequency domains. This category encompasses diverse applications across multiple scales.
Audio and speech signals consist of waveforms used for recognition and speaker identification. Classical tools include Python’s scipy.signal library and MATLAB’s Signal Processing Toolbox for spectral analysis and filtering. Modern approaches employ transformer-based audio processing and foundation models for speech and audio understanding, enabling end-to-end learning from raw waveforms.
Biomedical signals such as electrocardiograms (ECG) and electroencephalograms (EEG) are typically stored in specialized formats like EDF and WFDB. PhysioZoo provides comprehensive tools for photoplethysmography (PPG) analysis and heart rate variability benchmarks, while pySPACE facilitates EEG analysis. Modern deep learning approaches enable automated diagnosis, and foundation models now support multi-modal biomedical signal analysis, integrating diverse physiological measurements.
Sensor and IoT streams capture temperature, vibration, and industrial metrics sampled at high frequencies. These are increasingly stored in specialized formats like TsFile (developed by Apache IoTDB) or TSDF (Time Series Data Format), along with columnar formats, to ensure durability and efficiency. Preprocessing steps include filtering, resampling, and artifact removal. Modern approaches incorporate edge AI for real-time processing and foundation models for predictive maintenance, enabling proactive equipment monitoring.
1.1.2.4. Image and Video Time Series#
Sequences of images or video frames indexed by time are increasingly common in geospatial earth observation, scientific imaging, and medical monitoring. Landsat satellite imagery provides decades of multispectral observations tracking environmental changes across cities and landscapes. MRI scan progressions enable patient monitoring over treatment periods, while security cameras and wildlife monitoring systems generate continuous visual time series.
Storage approaches vary by application. Specialized multimedia containers combine audio, video, and annotations, but analytical workflows often represent image arrays as multi-dimensional arrays with dimensions for time, height, width, and spectral channels. Classical tools include scikit-image and OpenCV in Python. VANTAGE provides specialized capabilities for synchronizing video with bio-logger time-series data in animal behavior studies, while SamuROI facilitates multi-scale optical imaging analysis in neuroscience research. Modern vision transformers enable sophisticated video analysis, and foundation models now seamlessly combine computer vision and time series modeling. Multi-modal architectures can process synchronized video and sensor data, extracting insights impossible from either modality alone.
1.1.2.5. Event Camera Streams#
Ultra-fast vision sensors represent a paradigm shift from traditional frame-based cameras. Event cameras produce streams of asynchronous pixel-level events triggered whenever brightness changes occur, rather than capturing full frames at fixed intervals. This approach enables recording high-speed robotic motion or ball trajectories with minimal motion blur and dramatically reduced power consumption.
Classical analysis relies on specialized event-based vision algorithms, with data typically stored as event log files containing pixel coordinates, timestamps, and polarity information. Modern approaches employ neuromorphic computing architectures, spiking neural networks that process events asynchronously, and event-based transformer models that can learn spatiotemporal patterns directly from event streams.
1.1.2.6. Textual and Log Streams#
Sequences of time-stamped textual entries span structured system logs, chat transcripts, and social media posts. Twitter traffic during breaking news events, server and application logs for anomaly detection, and IoT text logs from connected sensors all exemplify this category.
Classical text mining approaches include trend detection, event correlation, and temporal pattern analysis. Modern large language models have transformed log analysis capabilities, while foundation models combining natural language processing with time series modeling enable contextual understanding of temporal text patterns. Preprocessing involves parsing, timestamp alignment, log template discovery, and text normalization. Python’s pandas handles time series logs effectively, while nltk and spaCy provide natural language processing capabilities. Specialized log analysis tools organize, search, and visualize event logs for operational intelligence.
1.1.3. Structural and Analytical Perspectives#
Understanding the distinction between metrics and events provides crucial insight into time series characteristics. Metrics represent regularly sampled measurements such as hourly weather readings, while events are irregular and trigger-driven, like system fault alerts. This distinction influences storage strategies, query patterns, and analytical approaches.
The evolution from classical to modern modeling reflects broader trends in data science. Classical approaches remain suitable for interpretable, statistical analysis using techniques like ARIMA, linear regression, and STL decomposition. Foundation models represent large-scale pre-trained architectures providing zero-shot and few-shot capabilities across diverse tasks and domains without task-specific fine-tuning. Hybrid approaches increasingly combine classical statistical methods with modern AI, leveraging the interpretability of traditional approaches with the power and generalization capability of foundation models.
1.1.4. Storage and Preprocessing Notes#
Time series databases like InfluxDB and TimescaleDB optimize time-indexed ingestion and querying. TimescaleDB excels with multi-metric analytics and provides SQL compatibility through its PostgreSQL extension, while InfluxDB is often preferred for sensor and IoT scale deployments with its custom query language.
Columnar data formats including Parquet and Arrow enable fast retrieval, storage efficiency, and seamless integration with Python and R ecosystems. These formats are particularly effective for analytic workloads where queries access many rows but only specific columns.
Event streaming platforms such as Apache Kafka and Apache Pulsar enable scalable, real-time ingestion and processing of event-driven or high-velocity time series. These platforms support distributed architectures with fault tolerance and exactly-once processing semantics.
Preprocessing considerations vary substantially across modalities. Numeric data requires imputation of missing values and outlier handling. Signal data demands filtering and noise reduction. Text streams need parsing and normalization. Each modality presents unique challenges that must be addressed before analysis.
Foundation model integration increasingly characterizes modern workflows. Pre-trained foundation models can handle multiple data modalities and tasks with minimal preprocessing, reducing the traditional feature engineering burden while improving generalization to new domains.
1.1.5. Current State of the Art: Foundation Models and Unified Approaches#
The field has recently witnessed transformative advances with foundation models—large, pre-trained architectures that can handle diverse time series tasks across domains.
Universal models like TimesFM, TimeGPT, Chronos, and TimesBERT provide zero-shot forecasting, anomaly detection, and classification across domains without requiring task-specific training. These models learn generalizable temporal patterns from diverse training data, enabling strong performance on unseen time series.
Multi-modal integration represents another frontier. Current architectures seamlessly combine numeric time series with text, images, and event data for contextual understanding. This integration enables richer analysis by leveraging complementary information across modalities.
Synthetic data augmentation techniques have advanced significantly, enhancing model training and enabling privacy-preserving applications. Generative models can create realistic time series that preserve statistical properties while protecting sensitive information.
Hybrid excellence characterizes state-of-the-art systems, which often combine classical statistical methods with foundation models. This approach leverages the interpretability and domain-specific insights of traditional methods while harnessing the power and adaptability of modern AI architectures.
Practical implications for students and practitioners are significant. Familiarity with both classical time series analysis—for interpretability and domain-specific insights—and modern foundation model APIs and frameworks—for scalable, generalizable solutions—has become essential. The most effective practitioners understand when to apply each approach and how to combine them for optimal results.
Format |
Description |
Classical Analysis Methods |
Modern AI Approaches |
Storage/Tools |
|---|---|---|---|---|
Numeric (uni/multivariate/panel) |
Timestamps w/ one or more numeric values |
ARIMA, VAR, regression, clustering |
Foundation models, transformers, zero-shot forecasting |
Time series DB (InfluxDB, TimescaleDB); pandas, R, Parquet |
Irregular/Event |
Irregular event records w/ timestamps |
Point processes, survival analysis |
Neural point processes, event transformers |
Kafka, Pulsar, Pandas |
Signal (Audio/Biomedical/Sensor) |
Continuous/discrete signals, high-frequency |
FFT, filtering, spectral analysis |
Deep learning, foundation models for signals |
TsFile, TSDF; scipy, MATLAB |
Images & Video Sequences |
Time-indexed visual frames |
Image processing, computer vision |
Vision transformers, multi-modal foundation models |
Multimedia containers, scikit-image, VANTAGE |
Event Camera Streams |
Pixel-level, event-based vision streams |
Event-based algorithms |
Neuromorphic computing, spiking neural networks |
Custom event log files, event-based analysis tools |
Textual/Log Streams |
Time-stamped text entries |
NLP, text mining, event correlation |
Large language models, multi-modal AI |
Pandas, NLP libraries (spaCy/nltk), log parsers |