Remark
Please be aware that these lecture notes are accessible online in an ‘early access’ format. They are actively being developed, and certain sections will be further enriched to provide a comprehensive understanding of the subject matter.
3.3. Raster Data Models#
Raster data is a type of geospatial data representation that uses a matrix of cells, commonly referred to as pixels, to model the Earth’s surface and various phenomena. This method is particularly effective for capturing and conveying information that changes continuously over space, such as elevation, temperature, or land cover.
3.3.1. Structure of Raster Data#
The raster data model consists of a grid of equally sized cells or pixels arranged in rows and columns. Each cell in this grid contains a value representing a specific characteristic of the area it covers, such as elevation, temperature, or land cover type.
Key Components:
Cells (Pixels): The basic units of a raster, typically square-shaped.
Resolution: Determined by the size of each cell, also known as Ground Sampling Distance (GSD).
Values: Each cell holds at least one value, which can be integer or floating-point.
Example 3.6
Consider a 2D array representing a raster grid. This example illustrates the key structural elements of raster data:
Cells: Each element in the array represents a cell in the raster grid. In a geographic context, each cell would correspond to a specific area on the Earth’s surface.
Values: Each cell contains a single integer value ranging from 0 to 100. These values could represent various types of data, such as temperature, elevation, or land cover classification.
Resolution: While not explicitly defined in this example, resolution refers to the size of each cell. For illustration, let’s assume each cell represents a 10x10 meter area on the ground. In real-world applications, the resolution would be precisely defined.
By applying a colormap to visualize this array, we can create a clear representation of the data distribution:
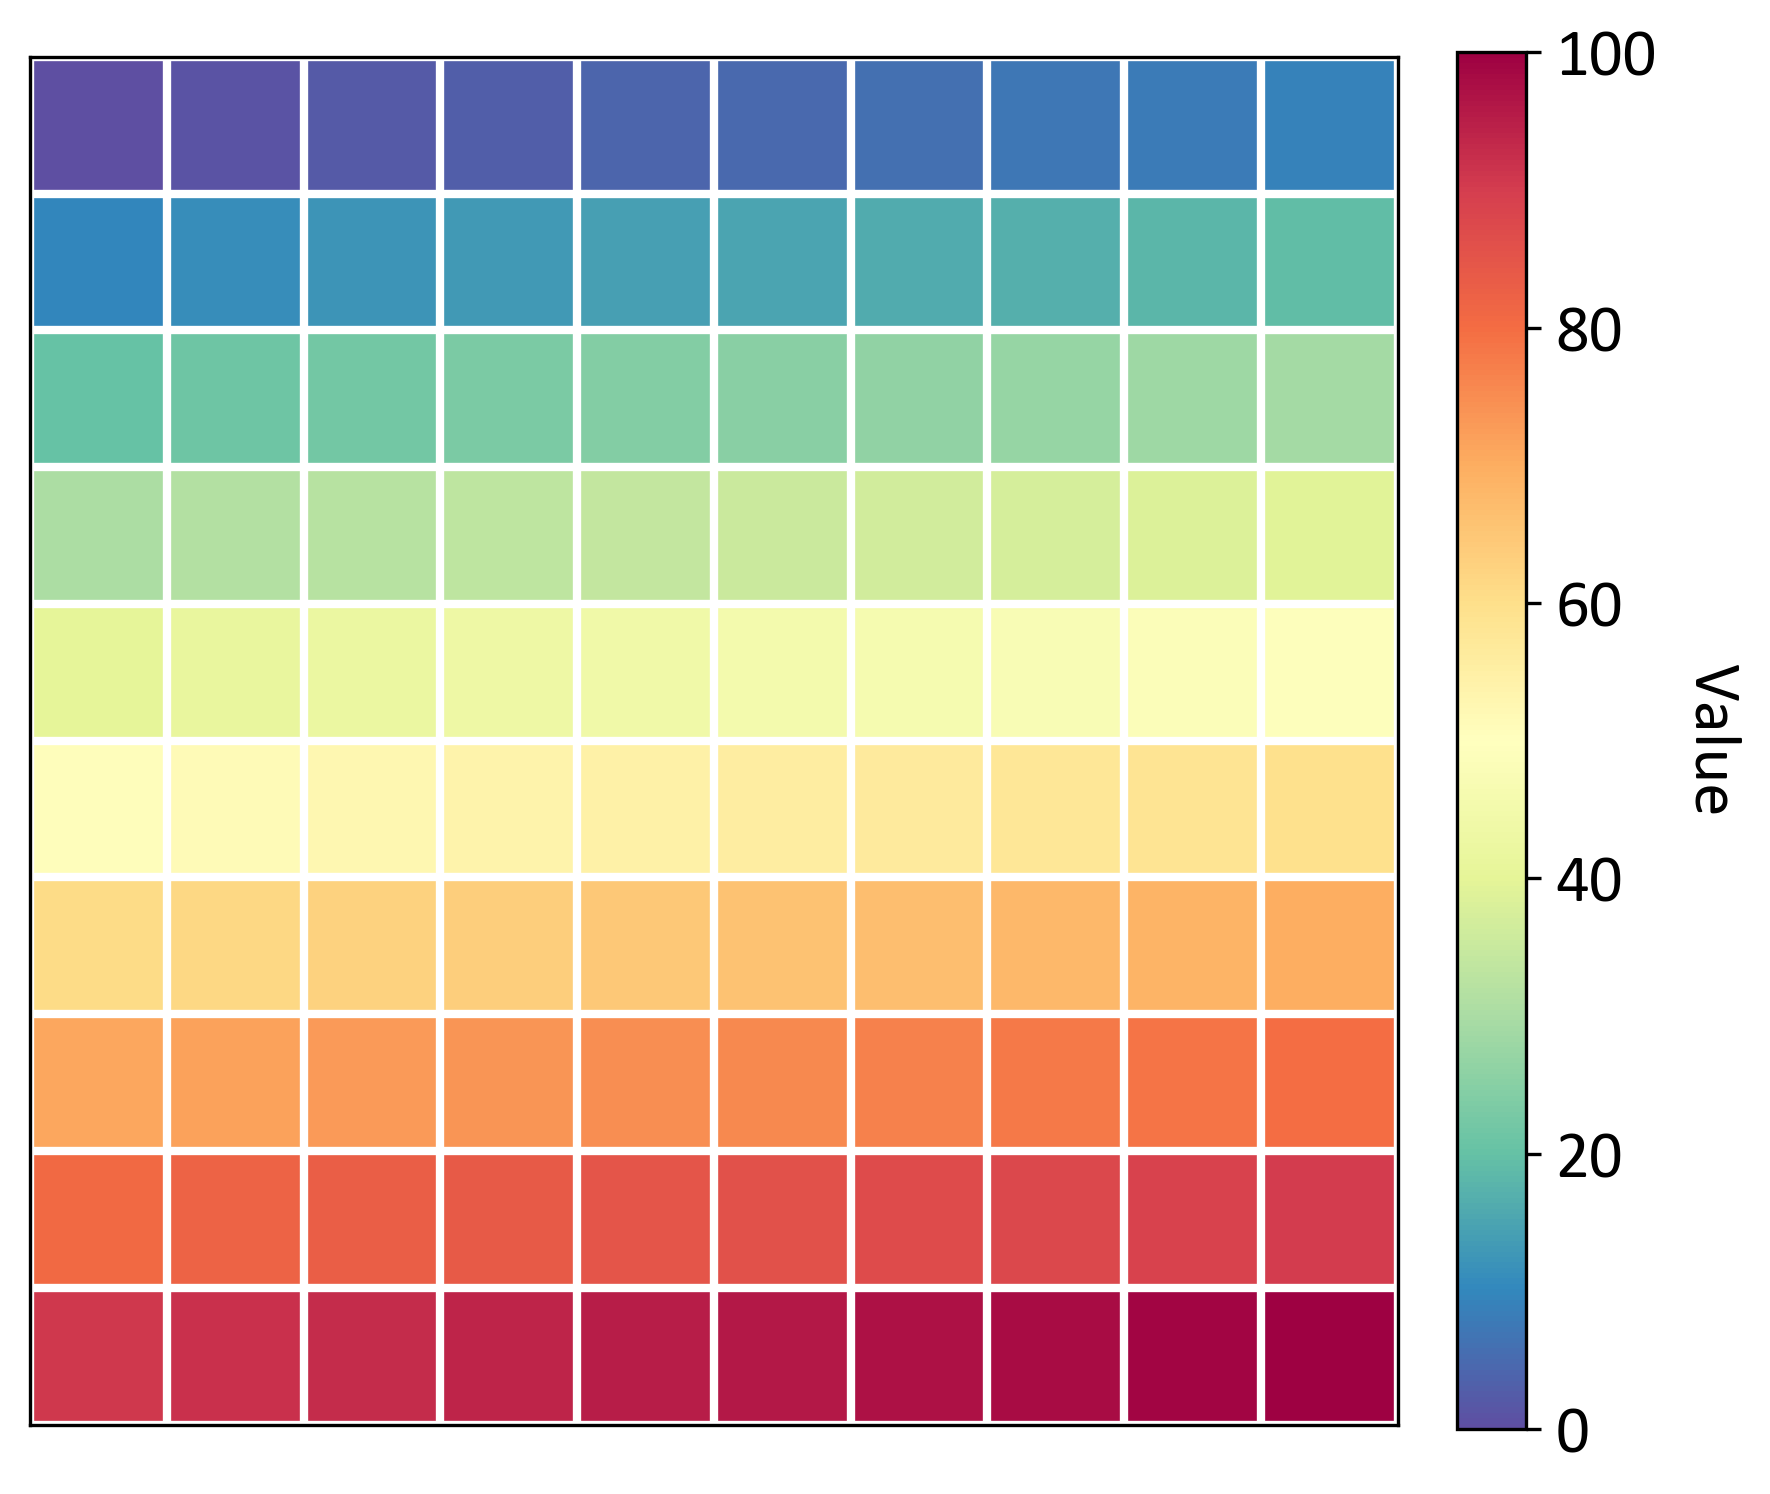
Fig. 3.3 Visualizing Data Patterns with a Colormap. This image shows a 2D colormap plot of the raster grid. Each cell’s value (0-100) is represented by a color, transitioning from dark blue (low values) to dark red (high values). The color bar on the right provides a reference for interpreting the values.#
3.3.2. Types of Raster Data#
Raster data can represent various types of information, generally categorized into three main types:
Thematic Data:
Represents discrete, categorical features
Each cell value corresponds to a specific class or theme
Examples: Land use categories (urban, agricultural, forest), soil types, or vegetation classifications
Often uses integer values to represent different categories
Thematic raster data is particularly useful for representing distinct, non-overlapping categories across a landscape. These rasters are used to represent discrete phenomena, where each cell contains a code referring to the type or class of the attribute being mapped [Longley et al., 2015].
Continuous Data:
Represents phenomena that change gradually across a landscape
Cell values are typically floating-point numbers
Examples: Elevation models, temperature distributions, or rainfall patterns
Allows for smooth transitions between values and interpolation
Continuous raster data is essential for modeling gradual changes in environmental variables. These rasters represent smoothly varying phenomena, where cell values are often real numbers and intermediate values between cells are assumed to exist [Bolstad, 2019].
Imagery:
Captures visual information of the Earth’s surface
Includes aerial photographs, satellite images, and scanned maps
Often uses multiple bands to represent different spectral information
Can be high-resolution, offering detailed visual representations of landscapes
Imagery raster data provides rich visual and spectral information about the Earth’s surface. Remote sensing imagery in raster format allows for the capture, storage, and analysis of electromagnetic energy reflected or emitted from the Earth’s surface.
3.3.3. Thematic Data#
Thematic data in raster format represents discrete, categorical features within a spatial dataset. Each cell value in a thematic raster corresponds to a specific class or theme, such as land use categories (e.g., urban, agricultural, forest), soil types, or vegetation classifications. These categories are typically represented using integer values, which denote different classes within the dataset.
Thematic raster data is designed to represent distinct, non-overlapping categories across a landscape. Each cell within a thematic raster contains a code that corresponds to a specific attribute or class being mapped [Longley et al., 2015]. This categorical representation allows for straightforward analysis and visualization of spatial patterns.
3.3.3.1. Key Applications of Thematic Rasters#
Thematic rasters are integral to a wide range of GIS applications because they provide a clear, easily interpretable representation of categorical spatial information. Some key applications include:
Land Use and Land Cover (LULC) Mapping: Thematic rasters are used to distinguish between different types of land use, such as residential, commercial, or natural areas. This helps in urban planning, resource management, and environmental monitoring.
Soil Classification: These rasters help map different soil types across a region, aiding in agricultural planning, land management, and environmental assessment. Accurate soil classification is crucial for sustainable land use and crop production.
Vegetation Type Mapping: Thematic data is crucial for identifying and classifying different types of vegetation, which is important for ecological studies, conservation efforts, and understanding biodiversity patterns.
Urban Planning and Zoning: Thematic rasters support zoning decisions by clearly showing the distribution of urban, industrial, and green spaces. This assists planners in making informed decisions about land development and infrastructure projects.
Habitat Classification: In ecological studies, thematic rasters are used to classify and monitor habitats, supporting biodiversity conservation efforts and habitat restoration projects.
Example 3.7 (Thematic Rasters - Land Cover Type Data)
A practical application of thematic raster data visualization is demonstrated through the MODIS Land Cover Type Product (MCD12Q1 - v061). This product illustrates how thematic rasters can represent discrete, categorical features across a landscape.
Thematic rasters, such as land cover maps, are derived from analyzing continuous raster data, often from sources like satellite imagery. In this example, the MODIS Land Cover Type Product is generated by classifying multispectral satellite data into distinct land cover categories. This classification process groups the values from multispectral data into specific classes, such as various vegetation types, and assigns a categorical value to each cell in the raster.
The visualization shown in Fig. 3.4 uses a predefined color palette that aligns with the International Geosphere-Biosphere Programme (IGBP) land cover classification system. The figure provides a visual representation of land cover types in the area surrounding Calgary, Alberta, Canada, based on the MODIS Land Cover Type data for the year 2013. The map is color-coded according to the IGBP classification scheme, which includes categories such as forests, shrublands, wetlands, and urban areas. Each category is assigned a specific color, facilitating the identification of different land cover types at a glance. A legend correlates the colors with the land cover categories, aiding in interpretation.
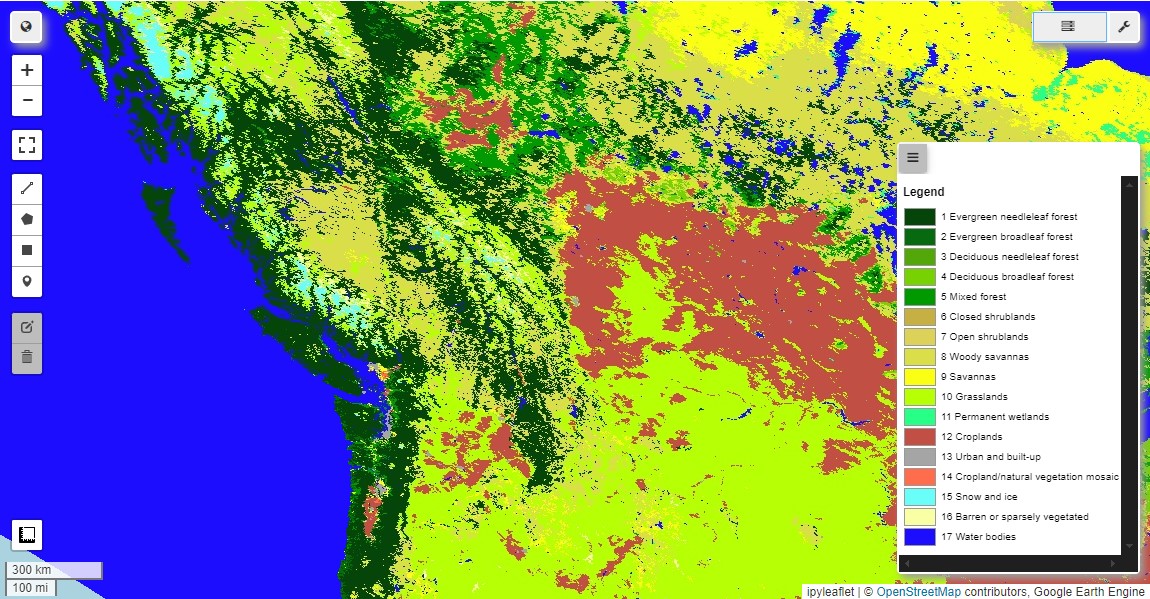
Fig. 3.4 This map illustrates the diverse land cover types in the vicinity of Calgary (and a greater view of North America), using the MODIS Land Cover Type data from 2013. The color-coded representation reflects the IGBP classification, providing insights into the region’s ecological diversity, from urban areas to natural vegetation and water bodies.#
This thematic raster visualization is a valuable tool for understanding the distribution and extent of different ecosystems and land uses in the region. It showcases the power of thematic rasters in simplifying complex spatial data into clear, categorical representations, allowing users to quickly identify spatial patterns and relationships.
Thematic rasters like this land cover map are essential for a wide range of applications, including [Canada, 2019]:
Environmental monitoring and change detection
Urban planning and land use management
Ecosystem assessment and biodiversity studies
Climate change impact analysis
Resource management and conservation efforts
The use of thematic rasters in these applications supports efficient analysis and decision-making processes. Each cell in the raster contains a single value that corresponds to a specific category, making it straightforward to quantify and analyze the distribution of different land cover types across the landscape [Canada, 2019].
3.3.3.2. Advantages of Thematic Rasters#
The strength of thematic rasters lies in their ability to simplify complex spatial data into clear, categorical representations. This simplification makes it easier to visualize and analyze spatial patterns, allowing users to quickly identify the distribution and extent of various classes across a landscape.
Moreover, thematic rasters are compatible with attribute tables, which can store additional information related to each category. This integration enhances the analytical potential of thematic data. For instance, in a land use raster, each category could be linked to attributes such as population density, economic value, or environmental impact. This provides a richer context for decision-making and analysis, enabling users to derive deeper insights from the data.
3.3.4. Continuous Data#
Continuous data in raster format represents phenomena that change gradually across a landscape, lacking distinct boundaries between categories. This type of raster data is defined by several key characteristics:
Gradual Change: It captures phenomena that vary smoothly over space, such as elevation, temperature, or precipitation.
Floating-Point Values: The cell values are typically stored as floating-point numbers, allowing for precise representation of continuous variables.
Smooth Transitions: This feature enables the representation of gradual transitions between values, which is essential for accurately modeling real-world phenomena.
Interpolation: Continuous raster data supports various interpolation techniques to estimate values between known data points.
Continuous raster data is crucial for modeling gradual changes in environmental variables. It represents smoothly varying phenomena, with cell values often expressed as real numbers, and intermediate values between cells are assumed to exist [Bolstad, 2019].
Example 3.8 (Continuous Data with Heatmaps)
To illustrate continuous raster data, consider a 10x10 matrix representing elevation data. This dataset can be effectively visualized using a heatmap, where a colorbar assigns specific colors to each cell value based on its elevation.
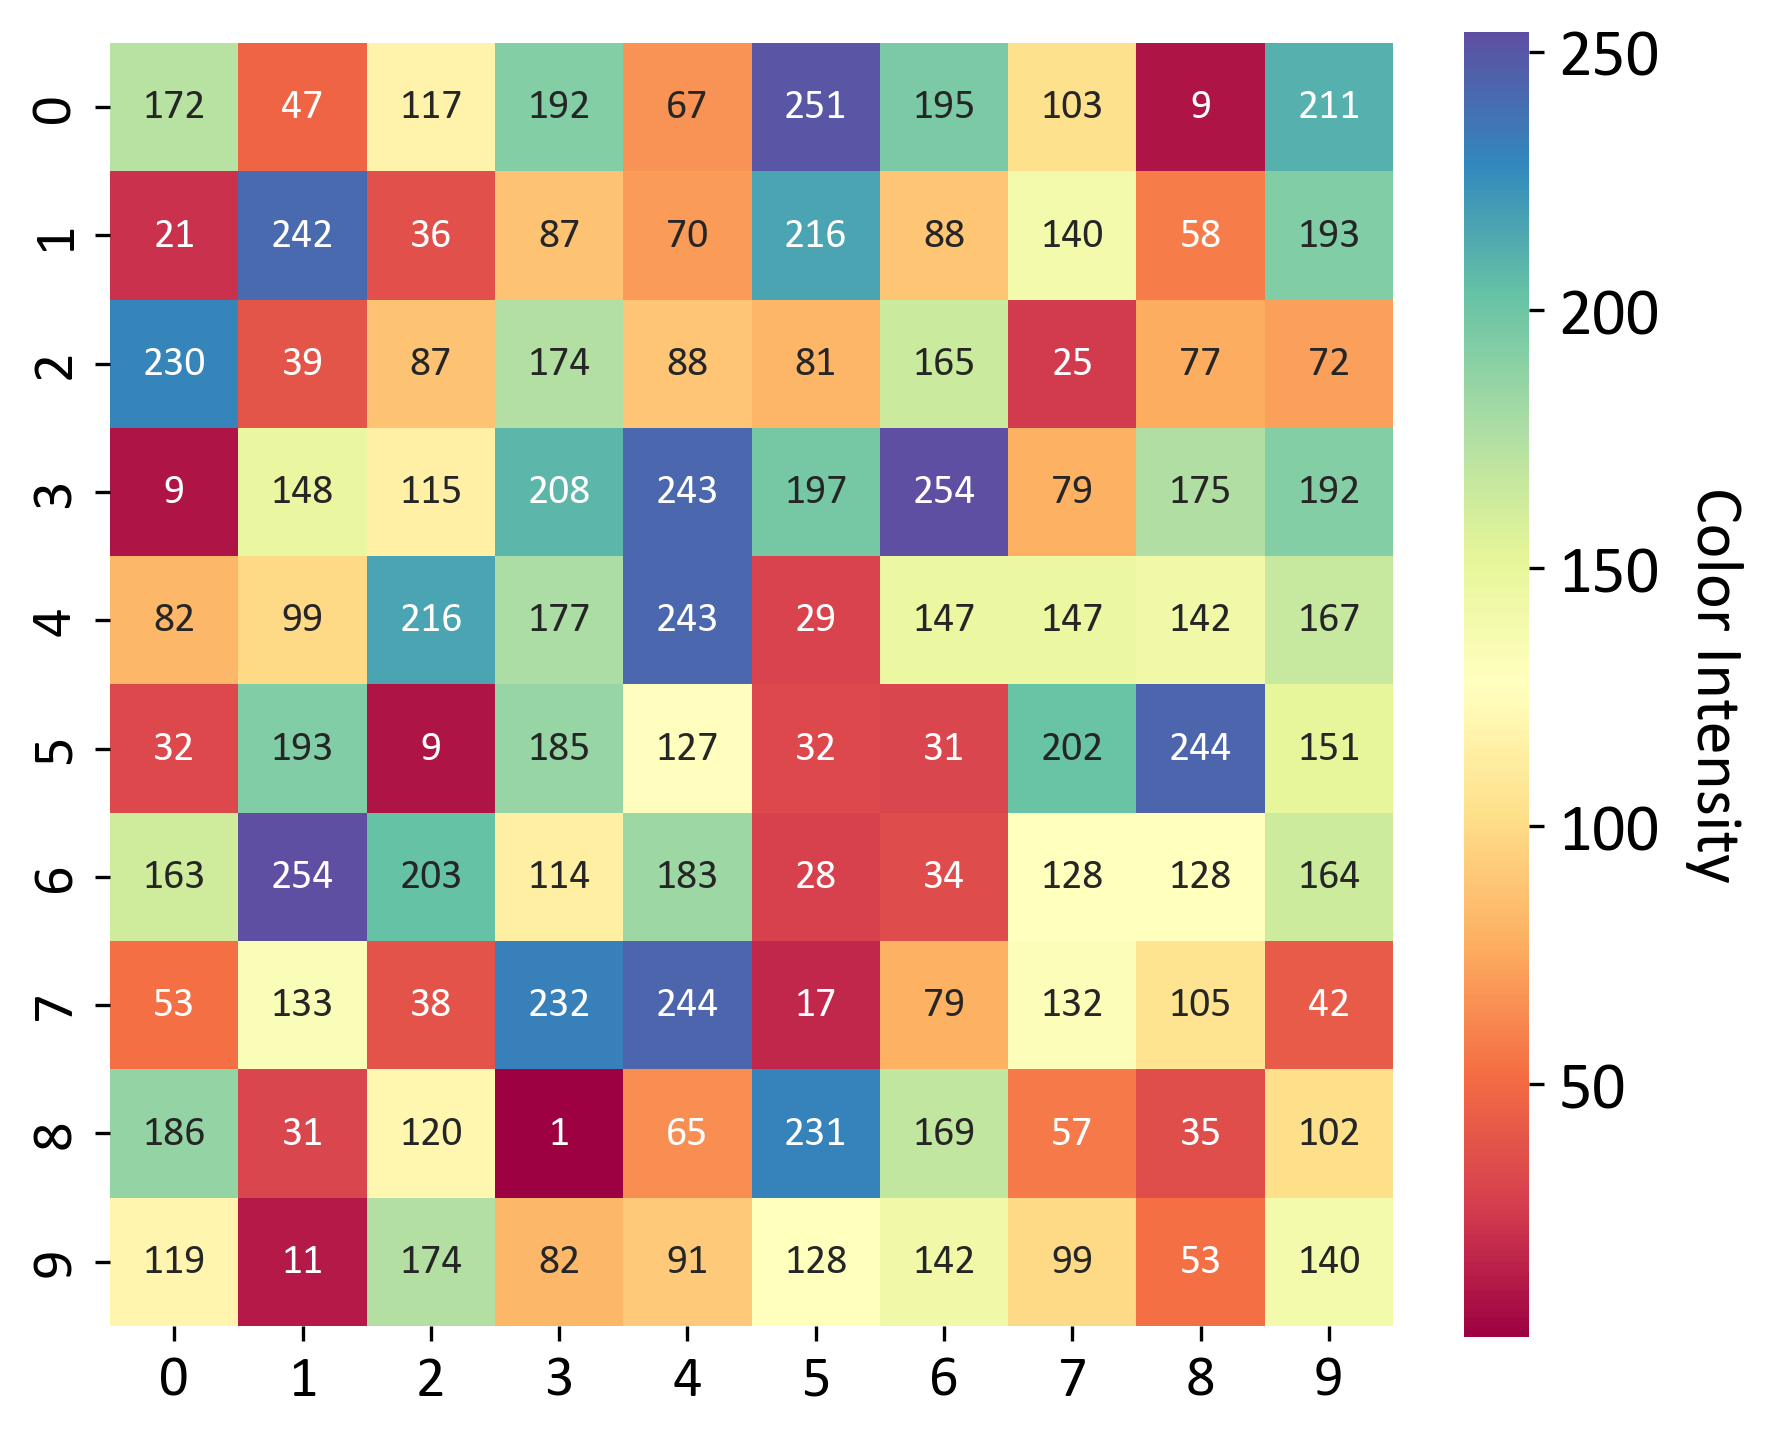
Fig. 3.5 Visualizing Continuous Raster Data with a Heatmap. This image depicts a 10x10 heatmap representing an elevation dataset. Each cell in the matrix is assigned a color based on its value, as indicated by the colorbar on the right. The colorbar ranges from 50 meters (light yellow) to 250 meters (dark red), effectively illustrating variations in elevation across the area.#
Heatmaps are particularly useful for visualizing continuous raster data such as Digital Elevation Models (DEMs), land surface temperature, or precipitation patterns. They allow for intuitive interpretation of data variations across a spatial extent.
Example 3.9 (Thematic and Continuous Data Example)
This example illustrates the practical application of raster data visualization by overlaying two key datasets: JRC Global Surface Water Mapping Layers, v1.4 and SRTM Digital Elevation Data Version 4.
The Shuttle Radar Topography Mission (SRTM) digital elevation dataset was created to provide consistent, high-quality elevation data on a near-global scale. This version has been processed to fill data voids and enhance usability.
The JRC Global Surface Water Mapping Layers dataset [Pekel et al., 2016] includes maps that detail the location and temporal distribution of surface water from 1984 to 2021, offering statistics on the extent and changes in these water bodies.
Fig. 3.6 displays the following two data layers:
Elevation Layer: This layer, derived from the SRTM Digital Elevation Model (DEM) Version 4, represents continuous data, with surface elevation displayed using a color gradient from 0 to 4000 meters.
Water Occurrence Layer: This layer, sourced from the JRC Global Surface Water dataset, represents thematic data by highlighting water bodies in blue, contrasted against land surfaces.
The map also includes a color bar for elevation, labeled “Elevation (m).” It is interactive, enabling users to explore various regions around Calgary. The combination of these layers provides valuable insights into the area’s topography and hydrography, which are critical for environmental studies, urban planning, and other analytical applications.
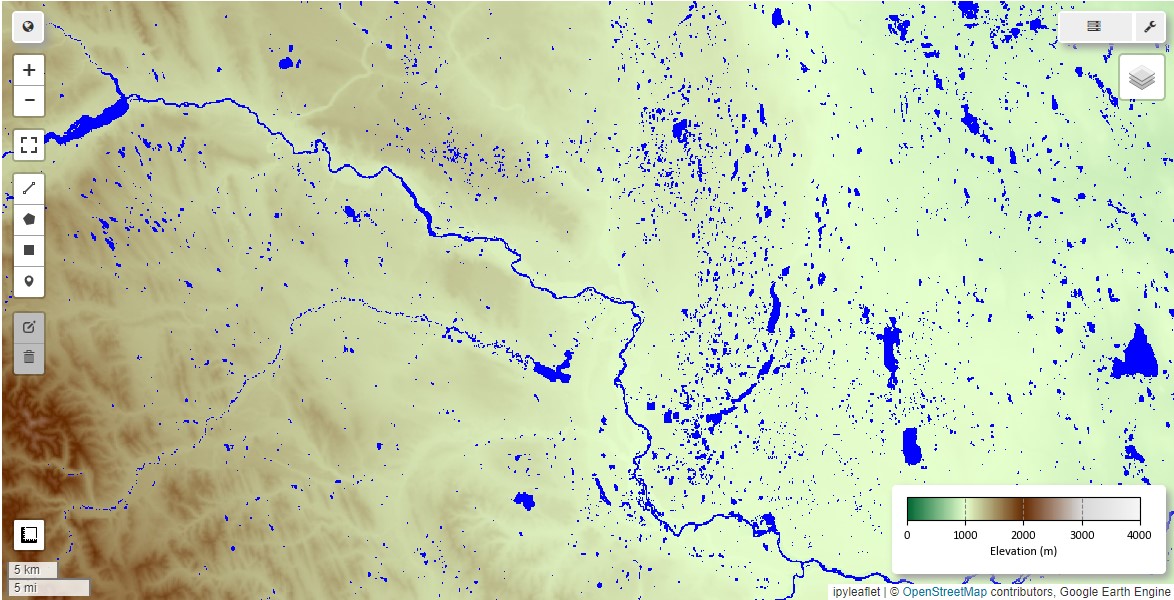
Fig. 3.6 Visualization of Calgary’s topography and hydrography. The map combines elevation data from SRTM DEM Version 4 (color-coded for altitude) with the JRC Global Surface Water layer (blue). This composite view offers a clear representation of the area’s terrain and water bodies, essential for various analytical purposes.#
3.3.4.1. Applications of Continuous Raster Data#
Continuous raster data is widely used in various geospatial analysis applications:
Digital Elevation Models (DEMs): DEMs represent terrain elevation and are vital for hydrological modeling, viewshed analysis, and slope calculations.
Climate Data: Continuous rasters are used to model temperature distributions, precipitation patterns, and other climatic variables across regions.
Environmental Monitoring: These rasters help in representing air quality indices, pollution levels, and soil moisture content.
Remote Sensing: Continuous rasters store and analyze spectral information from satellite or aerial imagery.
Hydrological Modeling: They are used to model water flow, accumulation, and drainage patterns.
3.3.4.2. Advantages of Continuous Raster Data#
Realistic Representation: Continuous data offers a more accurate representation of gradually changing phenomena compared to discrete classifications.
Supports Complex Analysis: It enables sophisticated spatial analysis techniques such as surface interpolation, terrain analysis, and hydrological modeling.
Flexibility in Visualization: Continuous data allows for various visualization techniques, including color gradients and contour lines, effectively communicating spatial patterns.
Compatibility with Mathematical Operations: This data format supports a wide range of mathematical and statistical operations, facilitating quantitative analysis of spatial phenomena.
3.3.4.3. Challenges and Considerations#
While continuous raster data has many advantages, it also presents certain challenges:
Data Size: High-resolution continuous rasters can require significant storage space and processing power.
Uncertainty Representation: Accurately representing uncertainty or error in continuous data can be complex.
Scale Dependency: The choice of cell size can significantly impact analysis results and should be carefully considered based on the phenomenon being studied.
Continuous raster data is essential in GIS and spatial analysis, offering a powerful tool for modeling and analyzing gradually changing environmental and physical phenomena. Its ability to represent smooth transitions and support complex spatial analysis makes it indispensable in fields ranging from environmental science to urban planning.
3.3.5. Imagery#
Imagery in raster format captures visual information of the Earth’s surface, offering a detailed perspective on landscapes and environmental features. This type of raster data has several defining characteristics:
Visual Representation: Imagery encompasses aerial photographs, satellite images, and scanned maps, providing a visual snapshot of the Earth’s surface at a specific moment in time.
Spectral Bands: Imagery often includes multiple spectral bands that capture different wavelengths of light reflected or emitted from the Earth’s surface, enabling detailed analysis of various environmental parameters.
High Resolution: High-resolution imagery delivers detailed visual representations, which are essential for applications that demand fine spatial detail.
Imagery raster data provides extensive visual and spectral information about the Earth’s surface. This data, often derived from remote sensing technologies, allows for the capture, storage, and analysis of electromagnetic energy reflected or emitted from the Earth’s surface.
Example 3.10 (Imagery Data Example)
The following example demonstrates the use of Sentinel-2 Harmonized surface reflectance imagery to visualize the area around Calgary, Alberta, Canada. The imagery is processed to mask clouds and cirrus using the QA band, providing a clear view of the landscape.
Bands Used: The true color composite is created using the red (Band 4), green (Band 3), and blue (Band 2) spectral bands, which are part of the visible spectrum and provide a natural color representation.
Time Period: The imagery covers the period from May to August 2023, capturing the summer season when vegetation is typically at its peak.
Processing Steps: Cloud and cirrus masking is applied using the QA60 band to ensure that only clear pixels are included in the visualization. The image is then normalized by dividing by 10,000 to convert the reflectance values to a 0-1 scale.
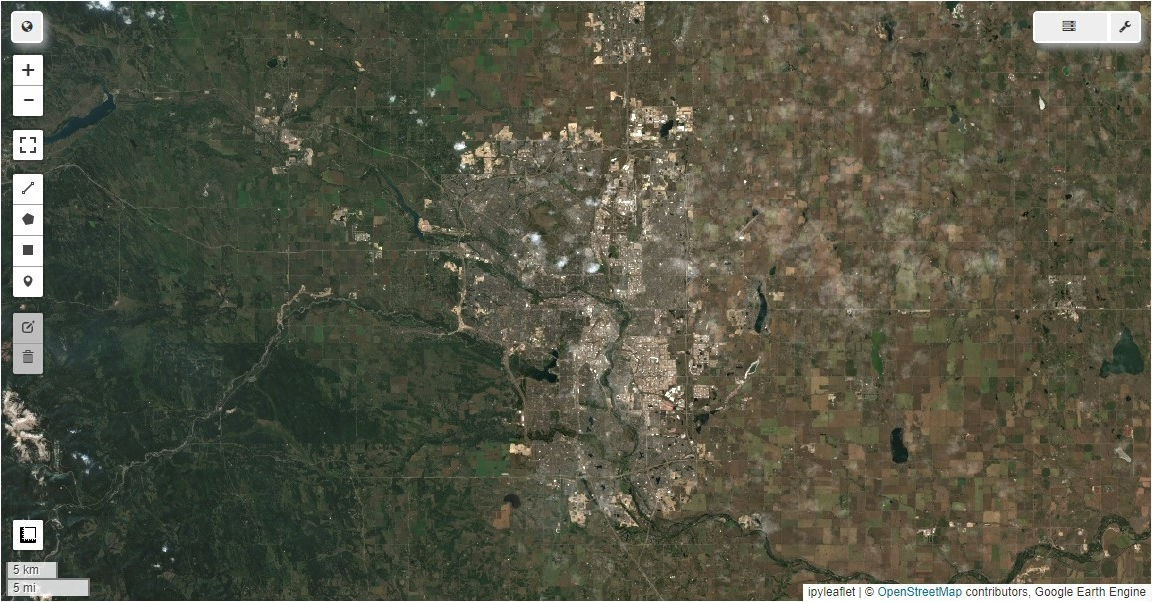
Fig. 3.7 This image represents a true color composite of Sentinel-2 data for Calgary, captured between May and August 2023. The visualization uses the red, green, and blue bands to create a natural color representation of the area, highlighting features such as urban areas, vegetation, and water bodies.#
3.3.5.1. Applications of Imagery Raster Data#
Imagery is integral to many geospatial applications:
Environmental Monitoring: Used to track changes in land cover, assess vegetation health, and monitor deforestation over time.
Urban Planning: Assists in evaluating land use patterns, infrastructure development, and urban expansion.
Agriculture: Supports monitoring of crop health, soil moisture levels, and irrigation patterns through multispectral and hyperspectral imagery.
Disaster Management: Enables the analysis of the impact of natural disasters such as floods, hurricanes, and wildfires, and aids in planning recovery efforts.
Climate Studies: Provides data for studying atmospheric conditions, sea surface temperatures, and ice cover through thermal and infrared imagery.
Biodiversity and Conservation: Facilitates mapping of habitats, tracking wildlife movements, and assessing ecological changes in protected areas.
3.3.5.1.1. Advantages of Imagery Raster Data#
Comprehensive Coverage: Imagery provides extensive coverage of large areas, facilitating regional and global analysis.
Temporal Analysis: Enables time-series analysis by comparing images from different dates, which is critical for detecting and analyzing changes over time.
Multispectral Analysis: Supports analysis across multiple spectral bands, allowing for detailed examination of various aspects of the Earth’s surface, such as vegetation indices and water quality.
Detailed Visualization: High-resolution imagery offers detailed visualizations, crucial for tasks that require precise spatial information.
3.3.5.2. Challenges and Considerations#
While imagery raster data offers significant advantages, it also poses certain challenges:
Data Volume: High-resolution and multispectral imagery can result in large data volumes, necessitating substantial storage and processing capabilities.
Cloud Cover and Atmospheric Effects: Imagery quality can be affected by cloud cover, atmospheric conditions, and sensor noise, which may impact the accuracy of the data.
Data Interpretation: Accurate interpretation and analysis of imagery, particularly in multispectral and hyperspectral formats, require specialized knowledge and tools.
Temporal Resolution: The frequency of image acquisition can limit the ability to monitor rapid changes or events.
Imagery raster data is essential in GIS and remote sensing, offering valuable insights into the Earth’s surface. It supports a wide range of applications, including environmental science, urban planning, and agriculture. The ability to capture detailed visual and spectral information makes it a powerful tool for understanding and managing the Earth’s resources and environments.
3.3.6. Advantages and Disadvantages of Raster Data#
3.3.6.1. Advantages of Raster Data#
Simplicity: Raster data is conceptually simpler and easier to work with compared to vector data, making it accessible to a wide range of users. Its grid structure allows for straightforward data representation and manipulation [Longley et al., 2015].
Suitable for Continuous Data: Raster data is ideal for representing continuous data like elevation or temperature gradients across landscapes. Each cell in a raster grid can represent a continuous value, allowing for smooth transitions and detailed surface modeling [Bolstad, 2019].
Fast Analysis: For certain types of spatial analysis, raster data can be processed quickly due to its regular grid structure. This facilitates efficient computation, particularly in operations like map algebra and quantitative analysis [Bivand et al., 2013].
Compatible with Remote Sensing: Raster data allows direct use of satellite imagery and other remotely sensed data, making it highly compatible with remote sensing applications. This compatibility is crucial for analyzing large-scale environmental and climatic phenomena [Lillesand et al., 2015].
Efficient for Large Areas: Raster data is efficient for storing and processing large amounts of data, especially for extensive geographical areas. Its grid-based format is well-suited for covering vast regions with consistent data representation [Longley et al., 2015].
Mathematical Modeling: Raster data is well-suited for mathematical modeling and quantitative analysis, such as terrain analysis or climate modeling. Its uniform grid structure simplifies the application of mathematical operations across datasets [Bolstad, 2019].
Overlay Analysis: Raster data facilitates overlay analysis and combination of multiple data layers. This capability is essential for integrating various datasets to derive new insights and support decision-making processes [Bivand et al., 2013].
3.3.6.2. Disadvantages of Raster Data#
Resolution Dependency: The level of detail in raster data is tied to pixel resolution. Higher resolution provides more detail but results in larger file sizes, which can be challenging to manage and store [Longley et al., 2015].
Spatial Inaccuracies: Limits imposed by raster cell dimensions can lead to spatial inaccuracies, especially for small or narrow features. This can result in the loss of detail and precision in representing geographic phenomena [Bolstad, 2019].
Large Storage Requirements: High-resolution raster data can require large storage space, particularly for extensive areas. This can be a significant drawback when dealing with large datasets or when storage resources are limited [Lillesand et al., 2015].
Loss of Precision: Raster data may lose precision when representing linear features or sharp boundaries due to its grid-based nature. This can lead to inaccuracies in depicting features like roads or property lines [Bivand et al., 2013].
Limited Scale of Application: Resolution dependency can affect analysis results and limit the scale of useful applications. Raster data may not be suitable for detailed analysis at finer scales due to its inherent resolution constraints [Longley et al., 2015].
Complex Attribute Representation: Representing complex attributes for a single location can be difficult without using multiple bands or layers. This complexity can complicate data management and analysis processes [Bolstad, 2019].