Remark
Please be aware that these lecture notes are accessible online in an ‘early access’ format. They are actively being developed, and certain sections will be further enriched to provide a comprehensive understanding of the subject matter.
2.3. Understanding Coordinate Systems#
2.3.1. Spatial Reference Systems (SRS) and Datums#
A Spatial Reference System (SRS) provides a framework to accurately determine and describe locations on the Earth’s surface. It integrates a coordinate system with a datum, and often a map projection, to enable precise georeferencing of spatial data. By standardizing how locations are measured and represented, SRSs facilitate the integration and comparison of spatial data from various sources, making them indispensable in geographic information systems (GIS) [Jones, 2014, Lu et al., 2014, Pászto et al., 2019].
2.3.2. Components of SRS#
Coordinate Systems: A coordinate system is a mathematical framework that provides a standardized method for specifying the precise location of points on the Earth’s surface. Coordinates can be expressed in various forms, most commonly as latitude and longitude in a geographic coordinate system, or as Cartesian coordinates \((x, y, z)\) in a projected coordinate system. The choice of coordinate system affects how spatial data is interpreted and how accurate the representation of location is in different contexts.
Datums: A datum serves as the foundational reference point that defines the origin, orientation, and scale of a coordinate system. It ensures that the coordinates correspond to actual physical locations on Earth by aligning the coordinate system with an ellipsoid that approximates the Earth’s shape. The datum accounts for variations in the Earth’s surface by establishing a reference ellipsoid and anchoring it at a specific location, known as the datum origin. This alignment is crucial for maintaining spatial accuracy, especially when integrating data from different sources or conducting geospatial analyses.
Map Projections: A map projection is a method used to represent the curved surface of the Earth on a flat plane, such as a map or a digital screen. This process involves mathematical transformations that project the three-dimensional geographic data onto a two-dimensional surface. Different map projections are designed to preserve certain spatial properties—such as area, shape, distance, or direction—while inevitably distorting others. The choice of projection depends on the specific needs of the project, such as the scale of the area being mapped or the particular spatial properties that need to be preserved.
2.3.3. Types of Coordinate Systems in GIS#
GIS rely on coordinate systems to accurately represent locations on the Earth’s surface. Coordinate systems are essential for mapping, spatial analysis, and data visualization. They provide a framework for defining real-world locations in digital environments.
There are several types of coordinate systems used in GIS, each serving different purposes and suitable for various applications. The three main types are:
Geographic Coordinate Systems (GCS)
Projected Coordinate Systems (PCS)
Local Coordinate Systems
2.3.4. Geographic Coordinate Systems (GCS)#
Geographic Coordinate Systems are based on a three-dimensional model of the Earth, which is either an ellipsoid or a sphere. Locations on the Earth’s surface are defined using angular measurements, typically in decimal degrees. These measurements include degrees of longitude (x-coordinates) and degrees of latitude (y-coordinates) [Kumar et al., 2023].
Example 2.6
The coordinates of Calgary, Alberta, Canada are approximately 51.0447° N latitude and 114.0719° W longitude. These coordinates pinpoint Calgary’s location on the globe with high precision. The World Geodetic System 1984 (WGS84) is a widely used GCS, especially in GPS technology, providing a standard reference for mapping and navigation.
Fig. 2.9 shows a world map in the Mercator projection, pinpointing the location of Calgary, Alberta, Canada. The coordinates given are 51.0474°N latitude and -114.0719°W longitude, which are in the WGS84 format commonly used for GPS.
Latitude (51.0474°N): Indicates Calgary is 51.0474 degrees north of the equator.
Longitude (-114.0719°W): Indicates Calgary is 114.0719 degrees west of the Prime Meridian.
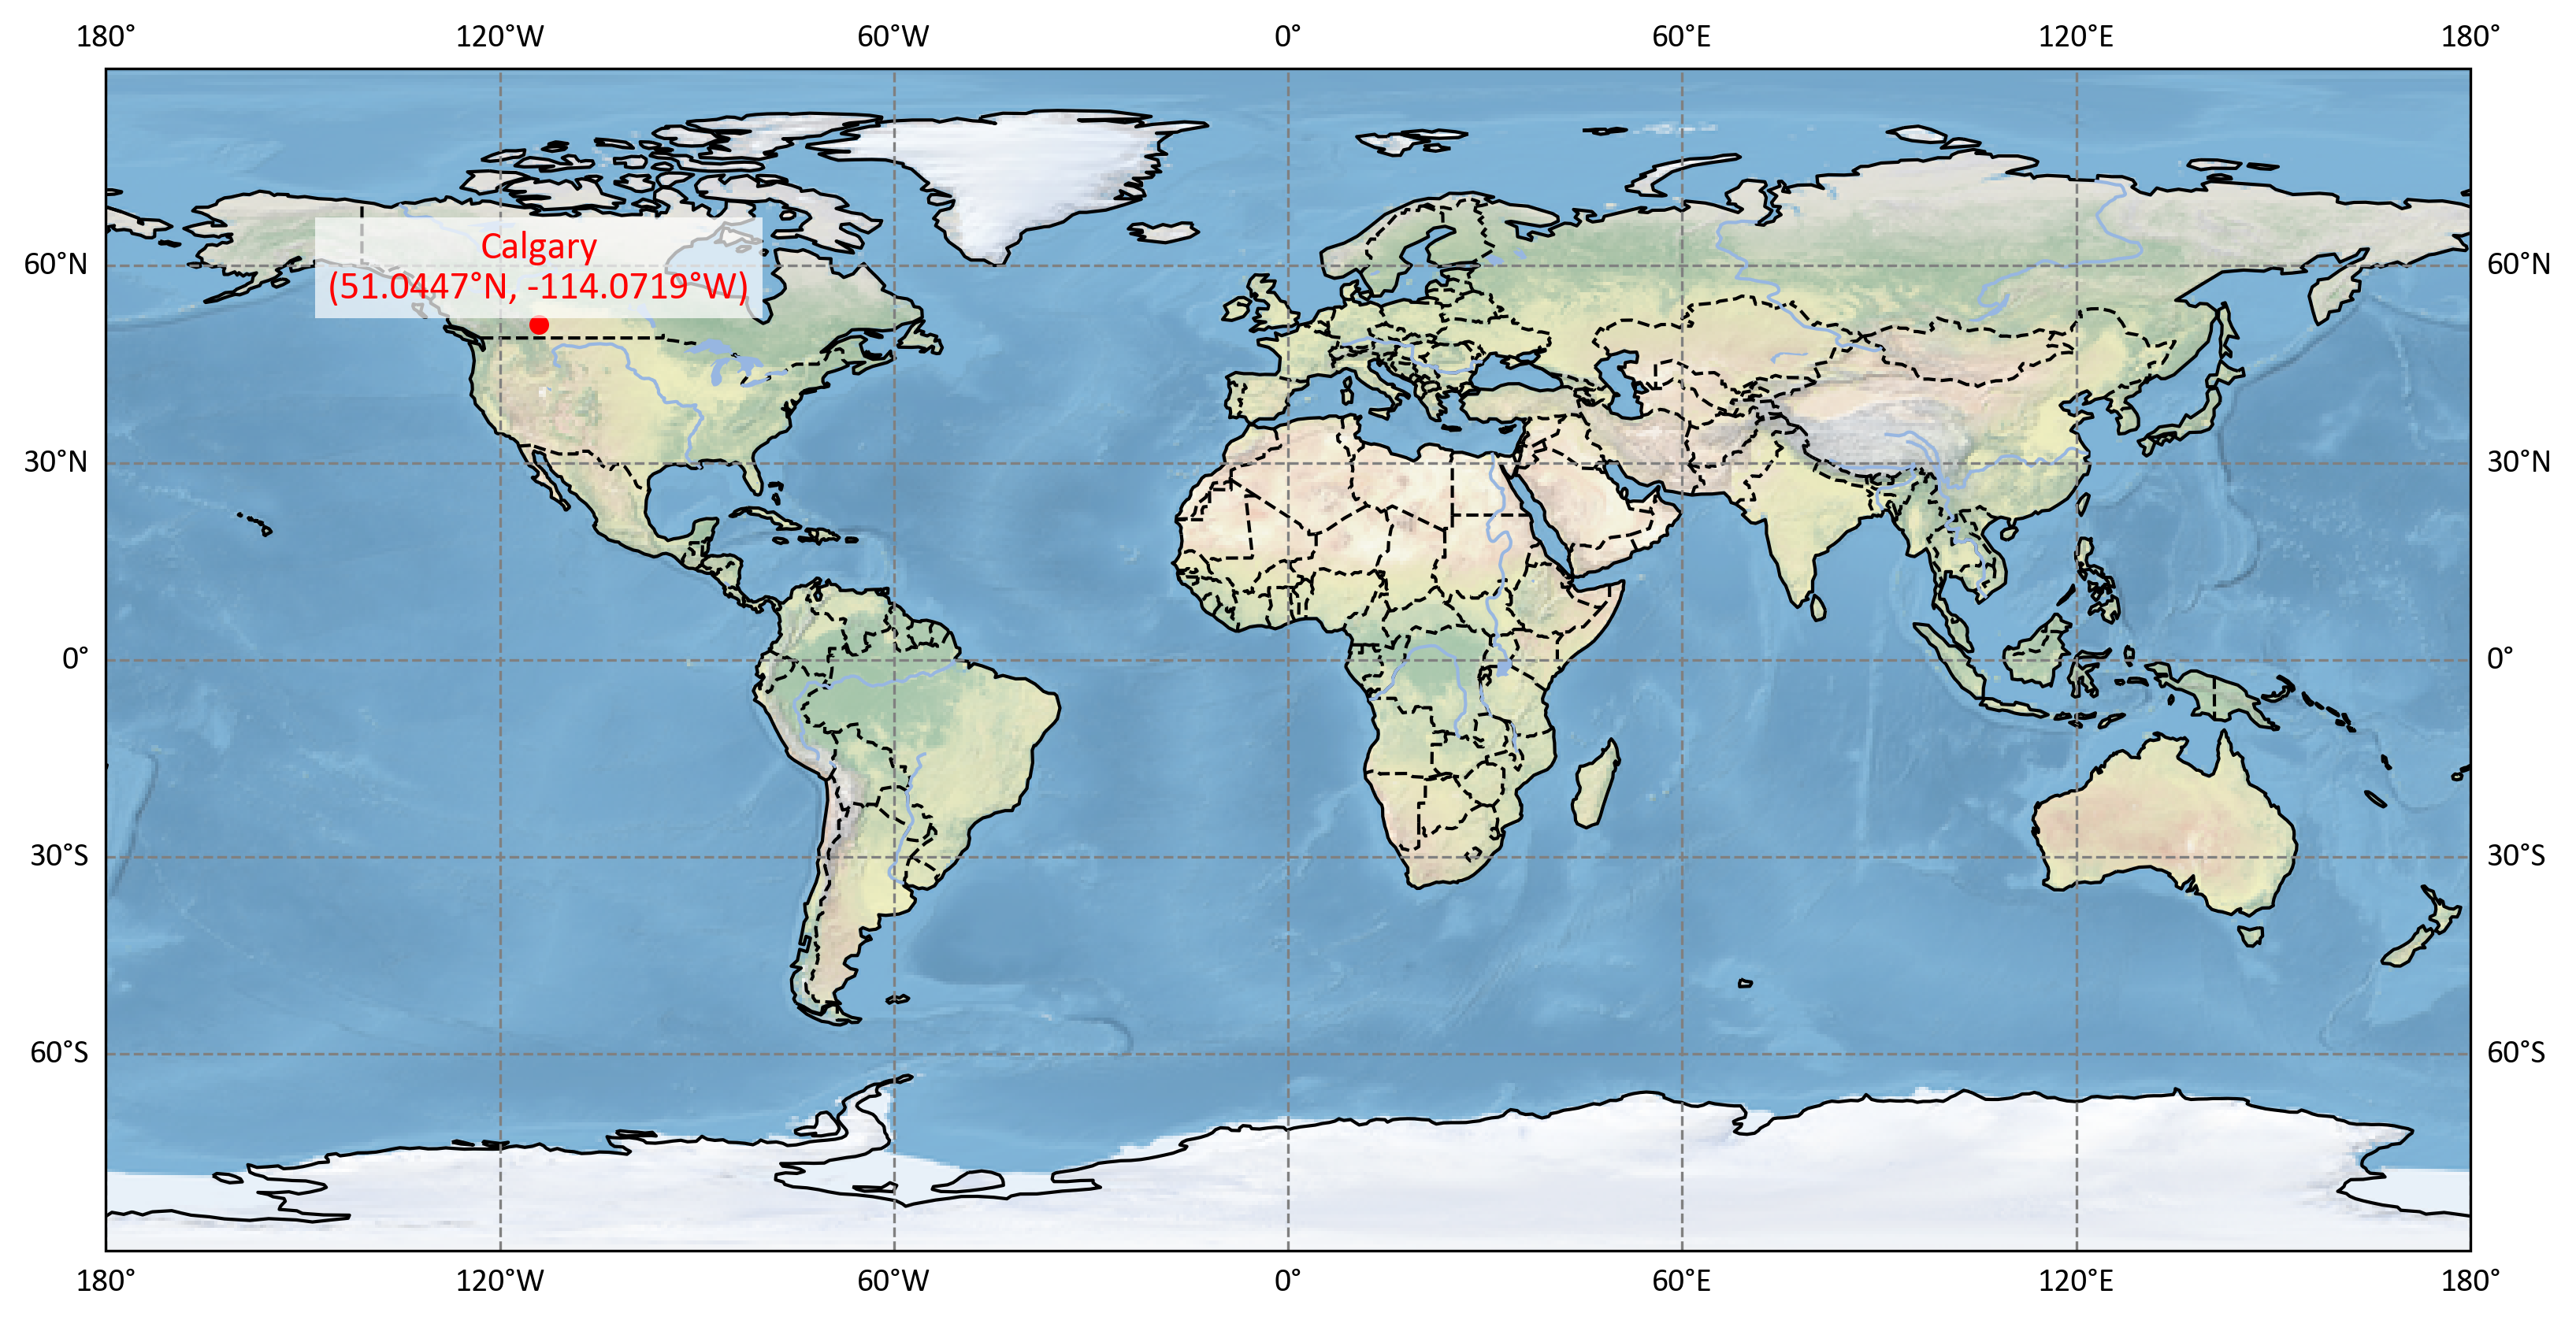
Fig. 2.9 Calgary, Alberta (WGS84 Coordinates).#
2.3.5. Projected Coordinate Systems (PCS)#
Projected Coordinate Systems (PCS) are used to represent the curved surface of the Earth on a flat plane, such as a map. Unlike Geographic Coordinate Systems (GCS), which use angular measurements (latitude and longitude), PCS use linear measurements (x and y coordinates). This makes it easier to measure distances and areas accurately on a flat map [Kumar et al., 2023].
A PCS is composed of two main components: a GCS and a map projection. The GCS provides the framework of latitude and longitude coordinates, while the map projection involves mathematical calculations to convert these angular coordinates into Cartesian coordinates (x, y). This conversion process allows for the creation of flat maps from the Earth’s curved surface.
One common example of a PCS is the Universal Transverse Mercator (UTM) system. The UTM system divides the world into a series of zones, each 6 degrees of longitude wide. Each zone has its own PCS to minimize distortion within that zone.
For instance, Calgary, Alberta, is located in both UTM Zone 11 and Zone 12 (See this link). By using separate zones, the UTM system ensures that maps are more accurate for regional mapping and large-scale projects.
Example 2.7
Imagine you are working on a construction project in Calgary, Alberta. Using the UTM system, you would refer to Zones 11 and 12. The coordinates for a specific location in Calgary might be given as 11U 706000mE 5660000mN. This means the location is 706,000 meters east and 5,660,000 meters north within Zone 11. This precise measurement is crucial for detailed engineering work, ensuring that all elements of the project are accurately placed.
Breakdown of UTM Coordinates:
Zone Designation (11U):
Zone Number: 11
UTM zones are divided longitudinally into 6-degree wide strips. Zone 11 covers longitudes from 114°W to 120°W, which includes part of Calgary.
Latitude Band: U
The “U” indicates the latitude band. UTM zones are split into bands from C to X (excluding I and O), with “U” covering latitudes from 48°N to 56°N.
Easting (706000mE):
This value represents the distance in meters east from the central meridian of the UTM zone.
The central meridian of Zone 11 is at 117°W. A false easting of 500,000 meters is applied to ensure all eastings within the zone are positive.
Thus, 706,000 meters east means the location is 206,000 meters east of the central meridian.
Northing (5660000mN):
This value represents the distance in meters north from the equator.
For the Northern Hemisphere, northing values start at 0 at the equator and increase northward.
Hence, 5,660,000 meters north indicates the distance from the equator to the location in Calgary.
Fig. 2.10 illustrates the Universal Transverse Mercator (UTM) zones, which are used for mapping and navigation. The world is divided into 60 vertical zones, each 6 degrees of longitude wide, labeled from 1 to 60. These zones are further divided into horizontal bands, labeled from C to X (excluding I and O), each 8 degrees of latitude high.
Zone Numbers: The numbers at the bottom of the map (1 to 60) represent the UTM zones, each covering a 6-degree longitudinal strip.
Latitude Bands: The letters on the side (C to X) represent 8-degree latitude bands, starting from 80° South to 84° North.
Highlighted Area: The map highlights Zones 11U and 12U, which include Calgary, Alberta, showing its specific location within the global UTM grid.
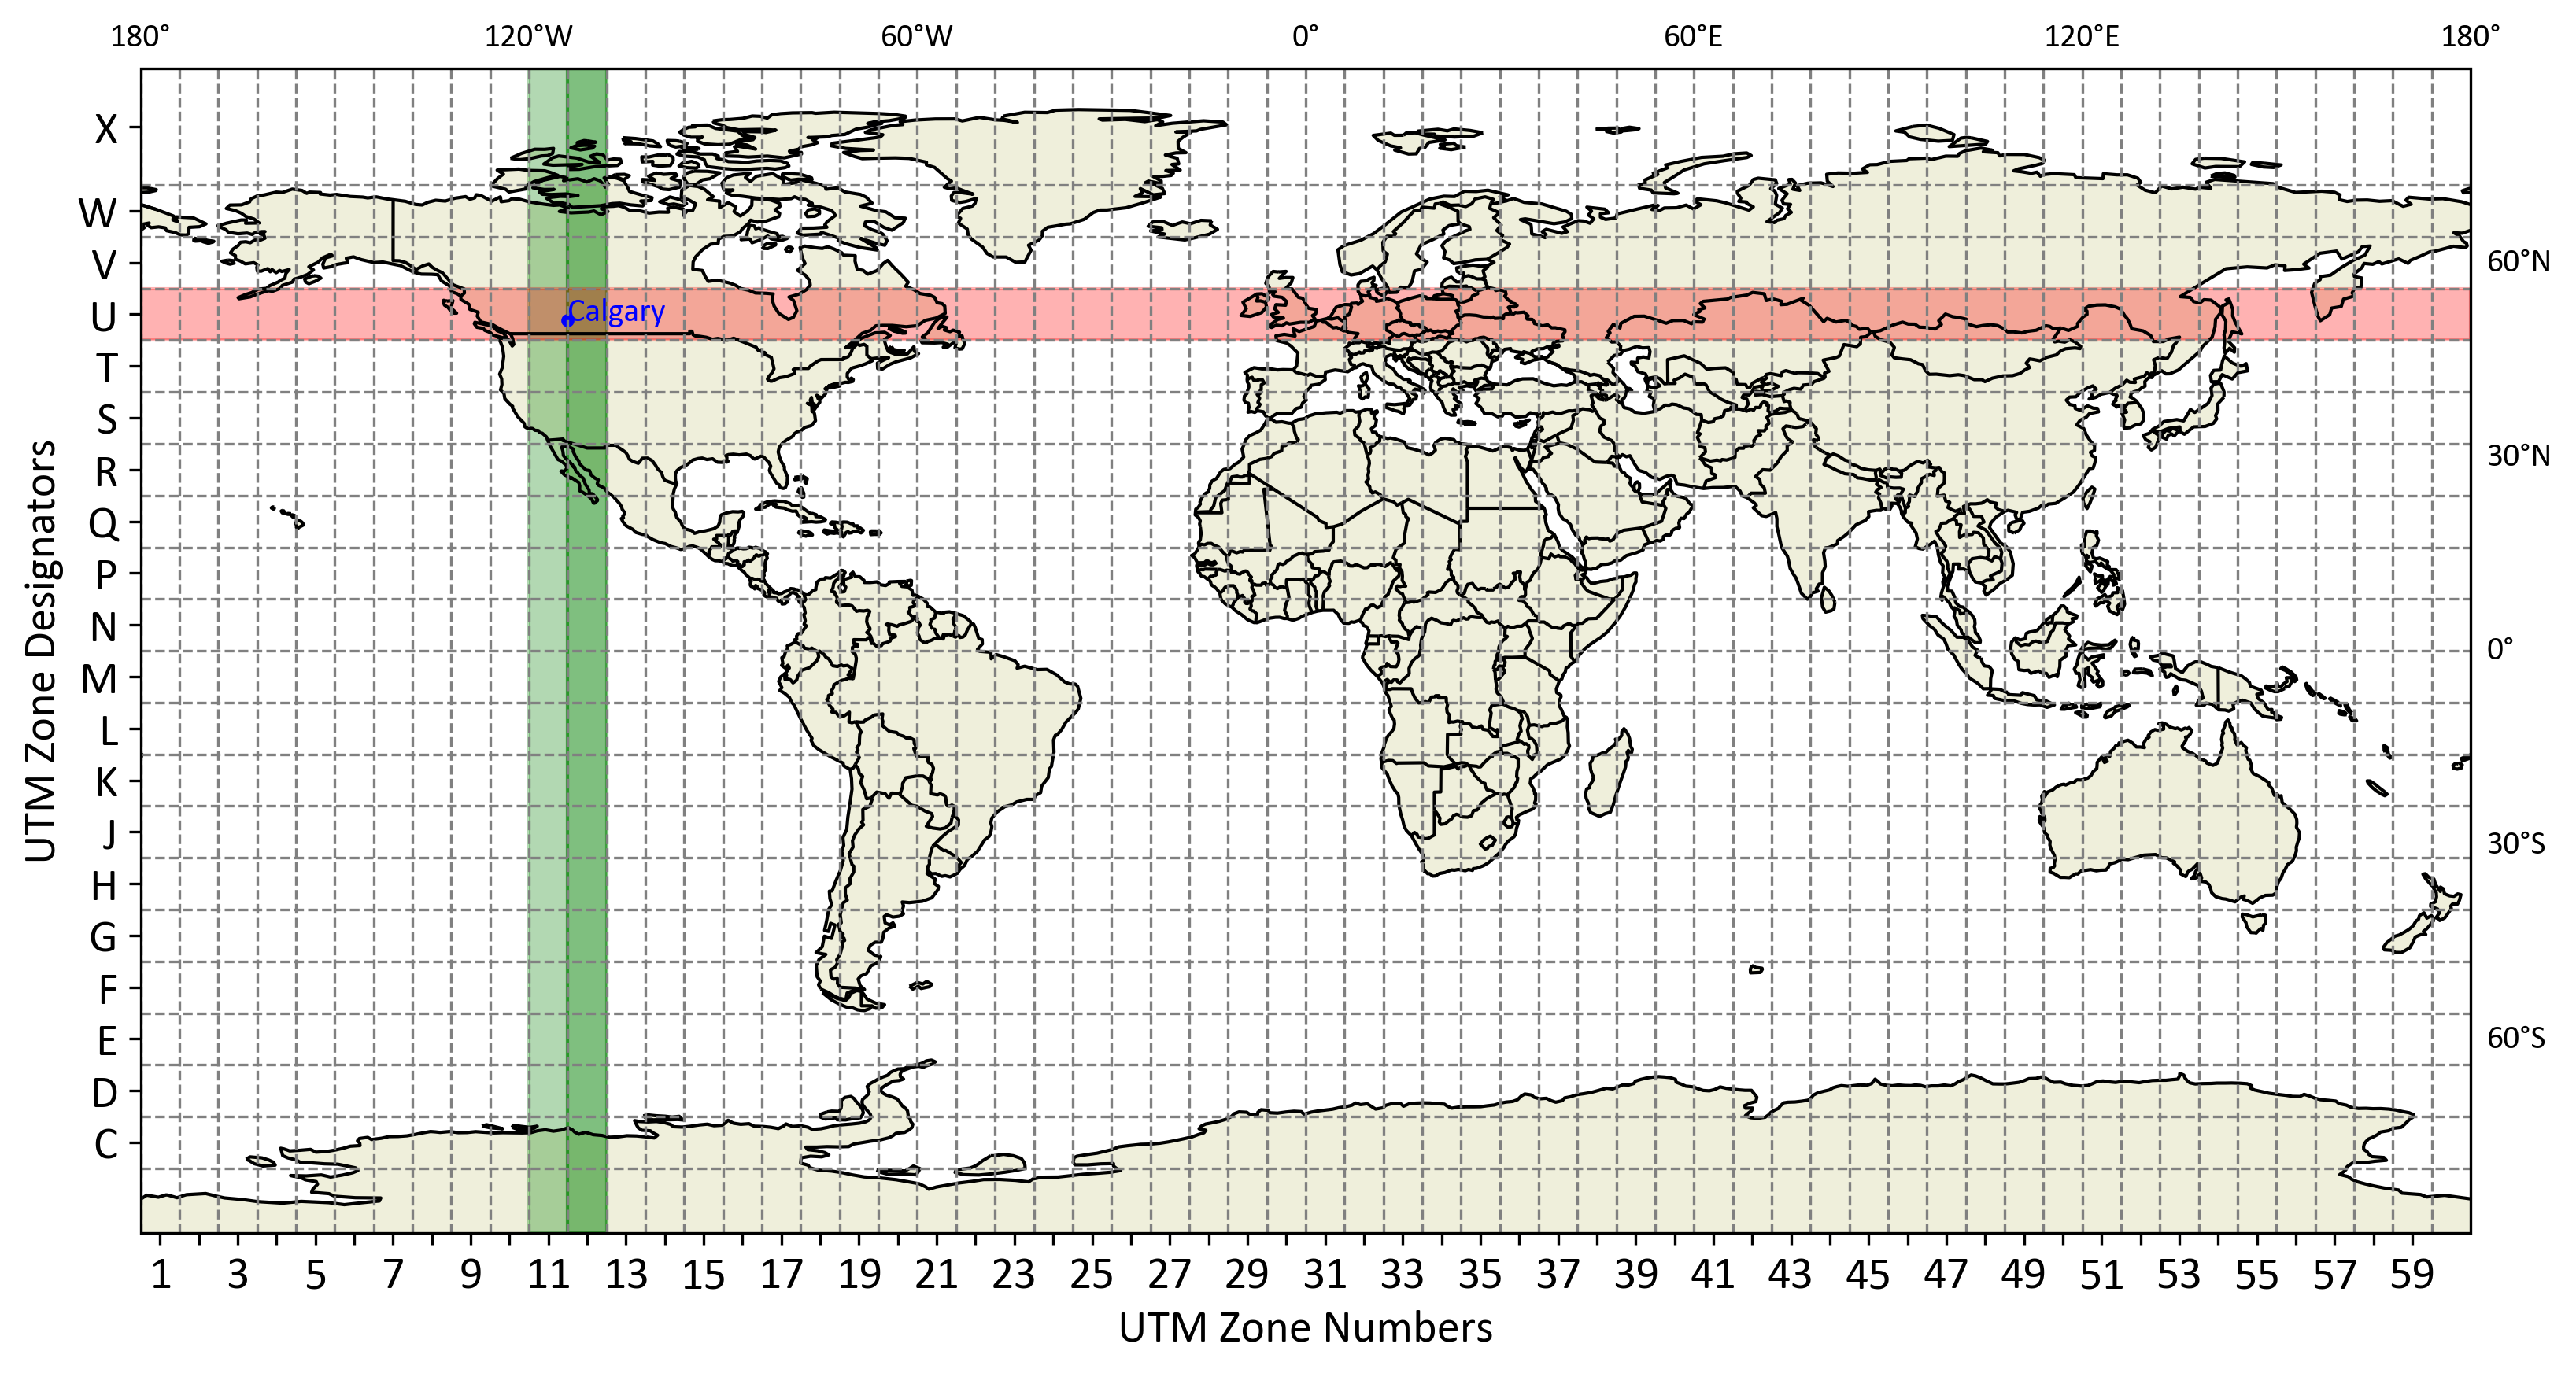
Fig. 2.10 UTM Zones Across the World.#
Let’s zoom in in Fig. 2.10. Fig. 2.11 illustrates the Universal Transverse Mercator (UTM) zones that cover Calgary, Alberta. The map highlights UTM Zone Designator “U” and UTM Zone Numbers 11 and 12.
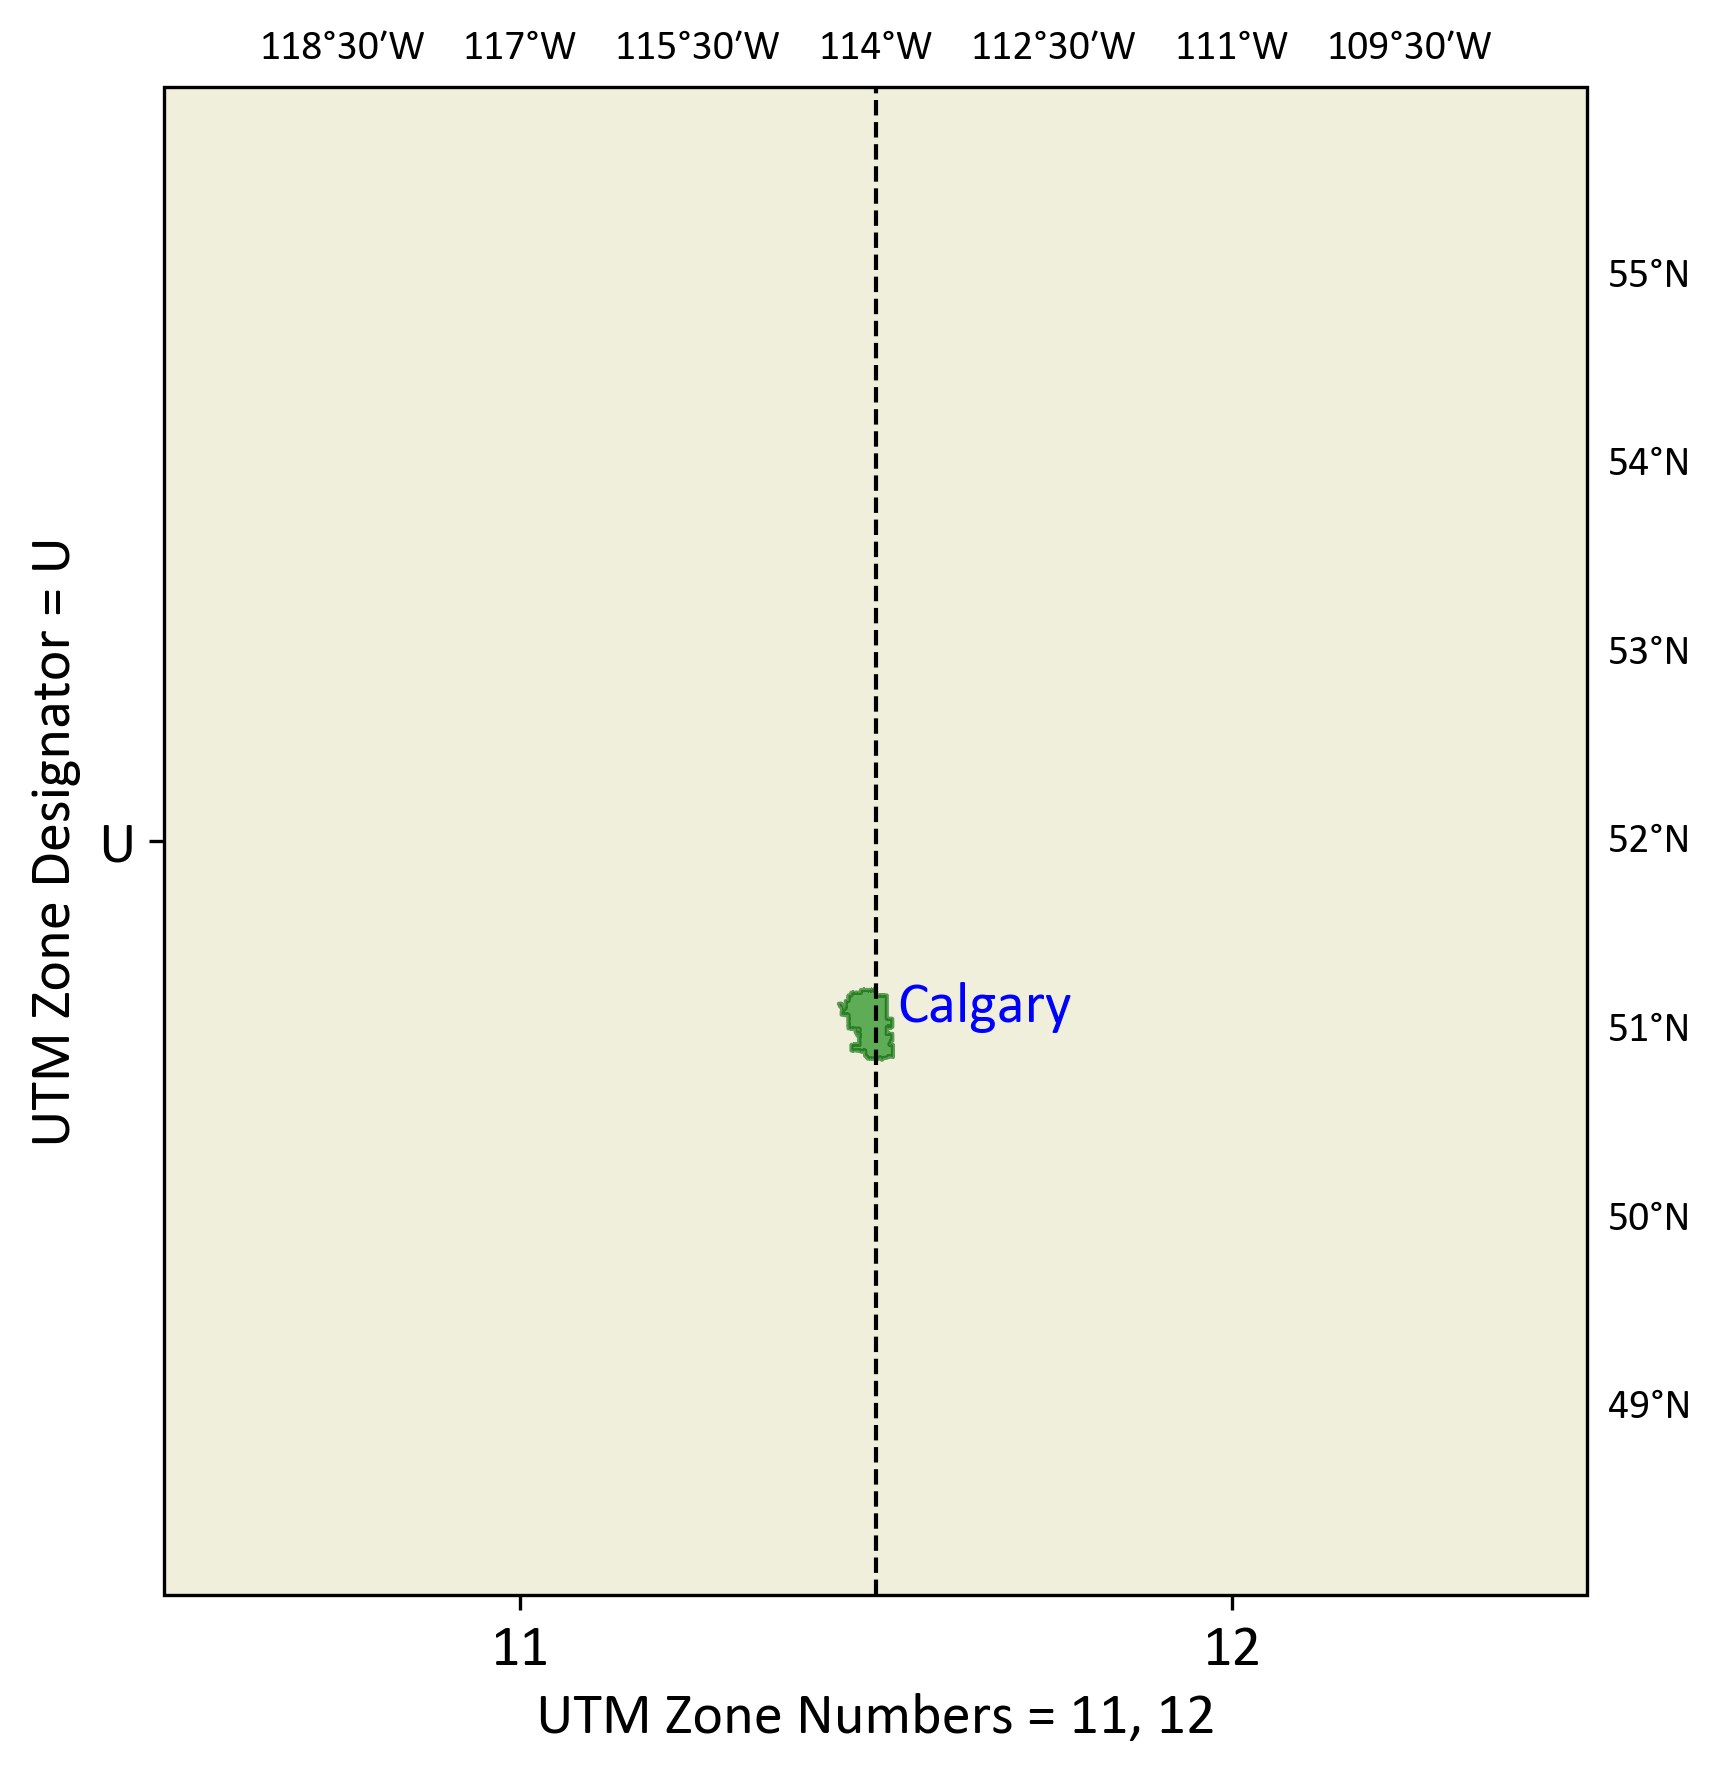
Fig. 2.11 UTM Zones Covering Calgary, Alberta.#
Note
The letters “I” and “O” are excluded from the UTM zone designations to avoid confusion with the numbers “1” and “0”³. This helps ensure clarity and reduces the risk of errors when reading and interpreting the coordinates.
2.3.6. Local Coordinate Systems#
Local Coordinate Systems are often used for engineering projects or other applications requiring high precision over a smaller area. These systems are tailored to specific locations and may not be compatible with global or regional coordinate systems. For example, a construction project might use a local coordinate system to ensure precise measurements and alignment. These systems are crucial for tasks that demand high accuracy, such as building infrastructure or conducting detailed land surveys [Kumar et al., 2023].
Example 2.8 (Examples of Local Coordinate Systems in Calgary, Alberta)
East Village Development:
A local coordinate system is established for the East Village area.
The origin (0,0) is set at a reference point, possibly the Calgary City Hall.
A specific point of interest, such as a new building corner, is located at coordinates (1319, -326), meaning 1319 meters east and 326 meters south of the origin.
Calgary Tower Area:
For projects around the Calgary Tower, a local coordinate system is used.
The origin (0,0) might be set at a convenient reference point in the downtown area.
The Calgary Tower itself is located at coordinates (559, -468) in this system, indicating it is 559 meters east and 468 meters south of the chosen origin.
Fort Calgary Historical Site:
A separate local coordinate system is established for archaeological and restoration work at Fort Calgary.
The origin (0,0) could be set at a significant point within the fort’s grounds.
A point of interest, perhaps a newly discovered artifact or a restoration project, is located at coordinates (1617, -58), meaning 1617 meters east and 58 meters south of the origin.
Fig. 2.12 illustrates:
Calgary Local Coordinate System (top): A local coordinate system is established with the origin set at Calgary City Hall (0,0). Several points of interest, such as East Village, Calgary Tower, and Fort Calgary, are plotted with their respective local coordinates relative to the origin. The distances are in meters, indicating the eastward and northward (or southward) positions from City Hall.
Calgary in 2D Map (bottom): A cartographic 2D map of the Calgary area centered around City Hall. Major landmarks are plotted, including the same points from the local coordinate system, overlaid on a map background retrieved from OpenStreetMap. The geographic coordinates (latitude and longitude) are displayed here.
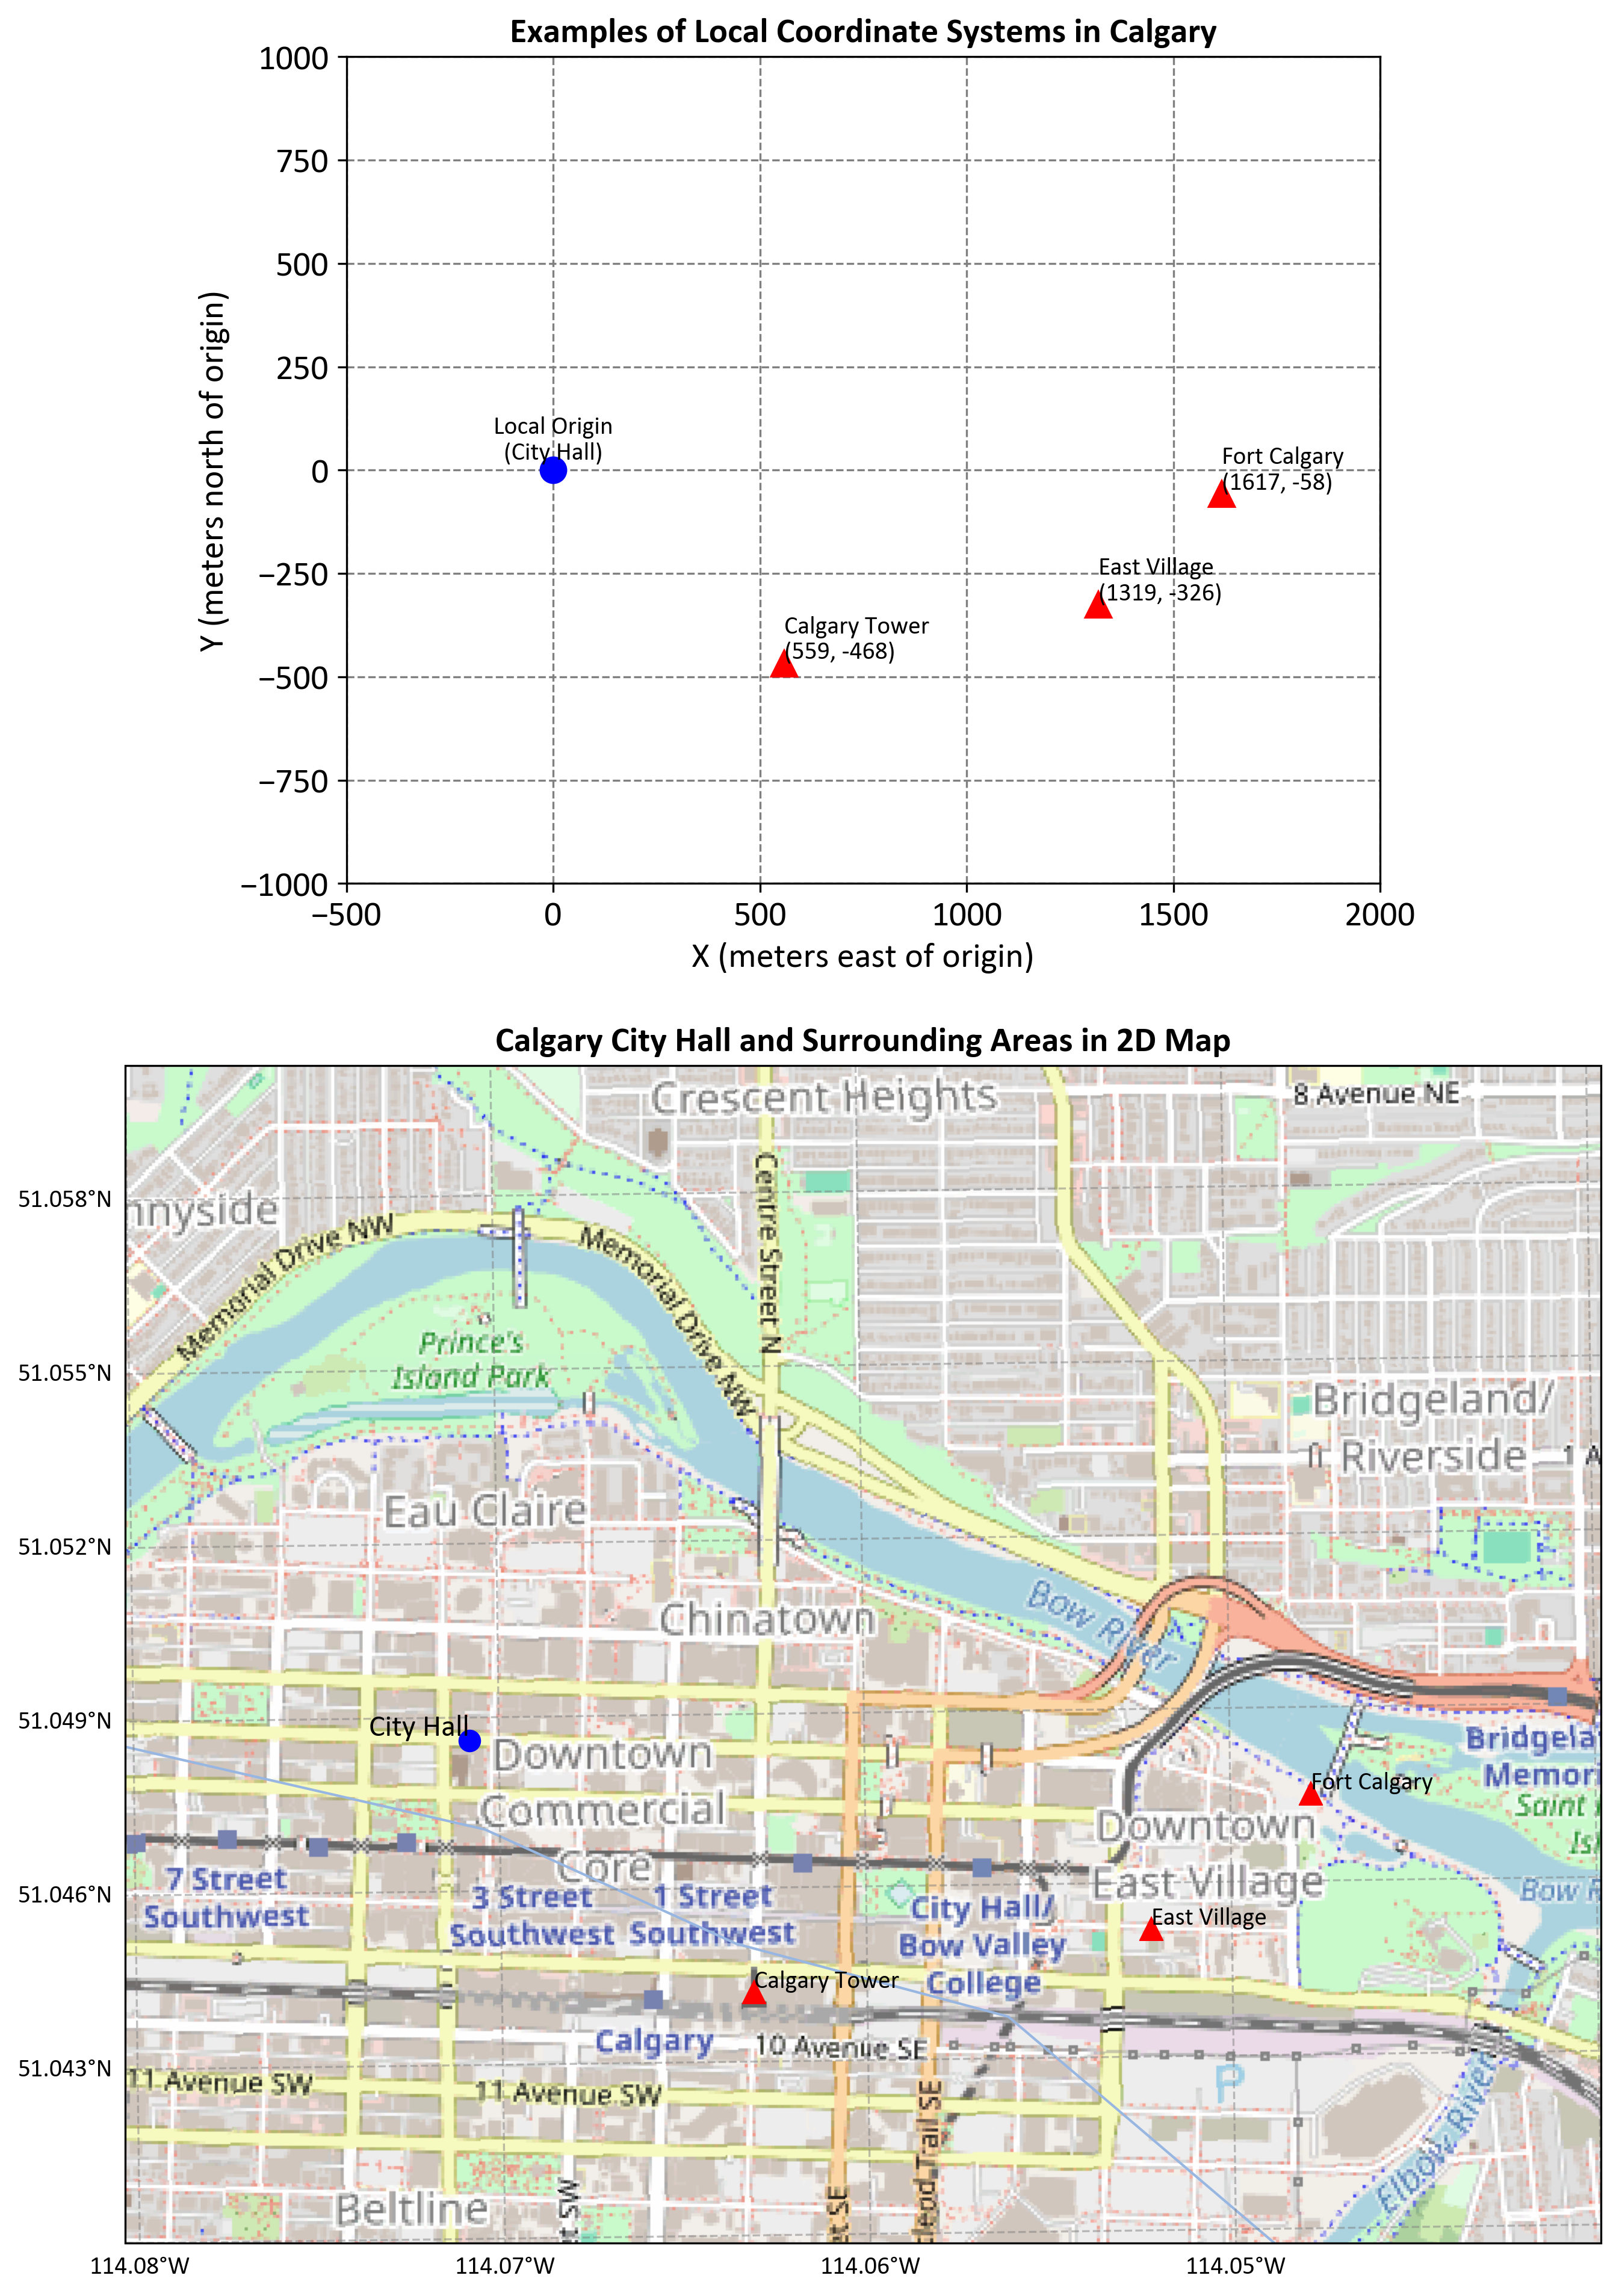
Fig. 2.12 Comparison of Local Coordinate Systems and 2D Cartographic Map in Calgary, Alberta.#
These local coordinate systems allow for precise measurements and planning within each specific area, tailored to the needs of different projects in Calgary.
2.3.7. Choosing the Right Coordinate System#
Selecting an appropriate coordinate system is crucial for the accuracy and usability of spatial data. The choice depends on the scale of the project, the region of interest, and the intended use of the data.
For global studies, a Geographic Coordinate System (GCS) like WGS84 is often used to ensure consistency across large areas.
For regional or local projects, a Projected Coordinate System (PCS) that minimizes distortion in that specific area is preferred.
For example, a city map of Calgary might use the UTM Zone 11N projection (a type of PCS) to provide accurate representations of streets and buildings. This system is well-suited for Calgary as it minimizes distortion in this region and uses meters as units, which is convenient for urban planning and construction.
2.3.8. Horizontal and Vertical Coordinate Systems#
Horizontal Coordinate Systems: These systems define where features are located across the globe. They use latitude and longitude to pinpoint locations. For example, the coordinates 51.0447° N, 114.0719° W identify downtown Calgary on a map.
Vertical Coordinate Systems: These systems define how high or deep features are relative to a surface, such as sea level. For instance, Calgary’s elevation is approximately 1,045 meters above sea level. Vertical coordinate systems are essential for applications like flood modeling in the Bow River basin, where knowing the elevation of land surfaces is crucial for predicting potential flood impacts.
2.3.9. Importance of Coordinate Systems in GIS#
Coordinate systems are vital for various GIS operations, including data integration, map creation, and spatial analysis. They ensure that spatial data from different sources can be compared and analyzed consistently.
Data Integration: When combining datasets from different sources, such as provincial land use data with municipal infrastructure data in Calgary, a common coordinate system ensures they align correctly.
Map Creation: Accurate maps depend on the correct use of coordinate systems to represent spatial relationships. For example, creating a map of Calgary’s public transit system requires precise positioning of bus stops, train stations, and route lines.
Spatial Analysis: In spatial analysis, such as calculating distances between neighborhoods or areas of parks in Calgary, consistent coordinate systems produce reliable results.
Without a common coordinate system, it would be challenging to overlay maps (e.g., combining geological and urban development maps of Calgary), compare spatial data, or conduct accurate spatial analyses, leading to errors and misinterpretations in urban planning and development projects.