Remark
Please be aware that these lecture notes are accessible online in an ‘early access’ format. They are actively being developed, and certain sections will be further enriched to provide a comprehensive understanding of the subject matter.
1.5. Spectral Resolution#
Spectral resolution refers to the ability of a remote sensing system to distinguish between different wavelengths or frequencies of electromagnetic energy. This capability is crucial for identifying, measuring, and analyzing different materials and phenomena on the Earth’s surface based on their spectral properties [Richards, 1986, Natural Resources Canada, 2007].
1.5.1. Wavelength Bands#
Spectral resolution is determined by the number and width of the wavelength bands that a sensor can detect. A sensor with high spectral resolution can detect many narrow bands, enabling detailed analysis of the spectral signatures of different materials [Schott, 2007].
Example 1.6 (High vs. Low Spectral Resolution)
High Spectral Resolution: A sensor that detects numerous narrow bands (e.g., 400-410 nm, 410-420 nm, etc.) can differentiate between very similar materials.
Low Spectral Resolution: A sensor that detects fewer broad bands (e.g., 400-500 nm) may only identify broader material categories.
1.5.2. Spectral Signatures#
Every material has a unique spectral signature, which is a specific pattern of reflection or absorption across various wavelengths. High spectral resolution allows for the precise identification of these signatures, which is essential for distinguishing between different materials [Borengasser et al., 2007].
Example 1.7 (Identifying Vegetation Types)
High Spectral Resolution: Can differentiate between healthy and stressed vegetation by detecting slight variations in the red and near-infrared bands.
Low Spectral Resolution: May only indicate the presence of vegetation without distinguishing its condition.
1.5.3. Multispectral vs. Hyperspectral Sensors#
Multispectral Sensors: Detect several broad wavelength bands. They are suitable for general observations and can identify broad categories of materials [Borengasser et al., 2007].
Example 1.8
Landsat satellites, which typically have 7-12 bands, can distinguish between different land cover types such as water, forest, and urban areas.
Hyperspectral Sensors: Detect hundreds of very narrow bands. They provide detailed spectral information, allowing for precise material identification and analysis.
Example 1.9
AVIRIS (Airborne Visible/Infrared Imaging Spectrometer), which has over 200 bands, can identify specific mineral types and vegetation species.
1.5.4. Applications of High Spectral Resolution#
High spectral resolution is essential in various applications due to its ability to detect and differentiate between materials with similar spectral characteristics.
Mineral Exploration: Different minerals have distinct spectral signatures. High spectral resolution sensors can accurately identify and map mineral compositions in a given area [Shirmard et al., 2022].
Example 1.10 (Mapping Mineral Deposits)
A hyperspectral sensor can detect the unique spectral features of minerals like quartz, hematite, and calcite, aiding in the exploration and extraction of mineral resources.
Agriculture: High spectral resolution is crucial for assessing plant health. Different conditions and diseases affect the spectral reflectance of plant leaves, and precise detection of these changes is necessary for effective monitoring and management [Huang et al., 2018].
Example 1.11 (Monitoring Crop Health)
Hyperspectral sensors can detect early signs of disease, nutrient deficiencies, or water stress in crops by analyzing subtle changes in their spectral reflectance patterns, allowing for timely intervention and improved crop management.
1.5.5. Visible Spectrum#
The visible spectrum is the portion of the electromagnetic spectrum that is visible to the human eye, ranging from approximately 400 nanometers (nm) to 700 nm in wavelength. This range encompasses all the colors we perceive in a rainbow. Below is a detailed explanation of the visible spectrum and its key points [Choudhury, 2014, Sliney, 2016]:
Wavelengths and Colors:
Violet:: 380-450 nm
Blue:: 450-485 nm
Green:: 500-565 nm
Yellow:: 565-590 nm
Orange:: 590-625 nm
Red:: 625-750 nm
Characteristics:
Visible Light: This is the light that human eyes can detect. It includes all the colors seen in a rainbow.
Spectrum Continuity: The visible spectrum is continuous, meaning there are no distinct boundaries between one color and the next. Colors blend smoothly into each other.
Pure Colors: Colors that consist of a single wavelength are called pure or spectral colors.
Note - Rainbows
When white light passes through a prism or water droplets, it splits into its component colors, creating a rainbow. This happens because different wavelengths of light bend by different amounts when they pass through a medium.
Practical Applications:
Environmental Monitoring: Visible light is used in satellite imaging to monitor changes in the environment. For example, it helps in observing deforestation, urban development, and water quality.
Mapping: Visible light is crucial for creating detailed maps of the Earth’s surface. This is used in topographical maps and land use planning.
Emergency Management: Visible light imaging is vital for disaster response and management, allowing for real-time assessment of areas affected by natural disasters like floods, hurricanes, and wildfires.
Fig. 1.18 illustrates the visible spectrum of light, which ranges from 400 to 700 nanometers (nm) or 0.4 to 0.7 micrometers (\(\mu\)m). Here’s a breakdown of the visible bands:
Blue:: 0.4-0.5 \(\mu\)m (400-500 nm)
Green:: 0.5-0.6 \(\mu\)m (500-600 nm)
Red:: 0.6-0.7 \(\mu\)m (600-700 nm)
These bands represent the different colors of light that are visible to the human eye, with each color corresponding to a specific range of wavelengths. The image helps to visualize where these colors fall within the broader electromagnetic spectrum.
Fig. 1.18 illustrates the electromagnetic spectrum, showing different types of radiation arranged by their frequency (increasing from left to right) and wavelength (increasing from right to left). The spectrum includes gamma rays, X-rays, ultraviolet (UV), visible light (highlighted in colors from violet to red), infrared (IR), microwaves, FM and AM radio waves, and long radio waves. The visible spectrum is a small portion of the entire range, emphasizing the limited range of light visible to human eyes.
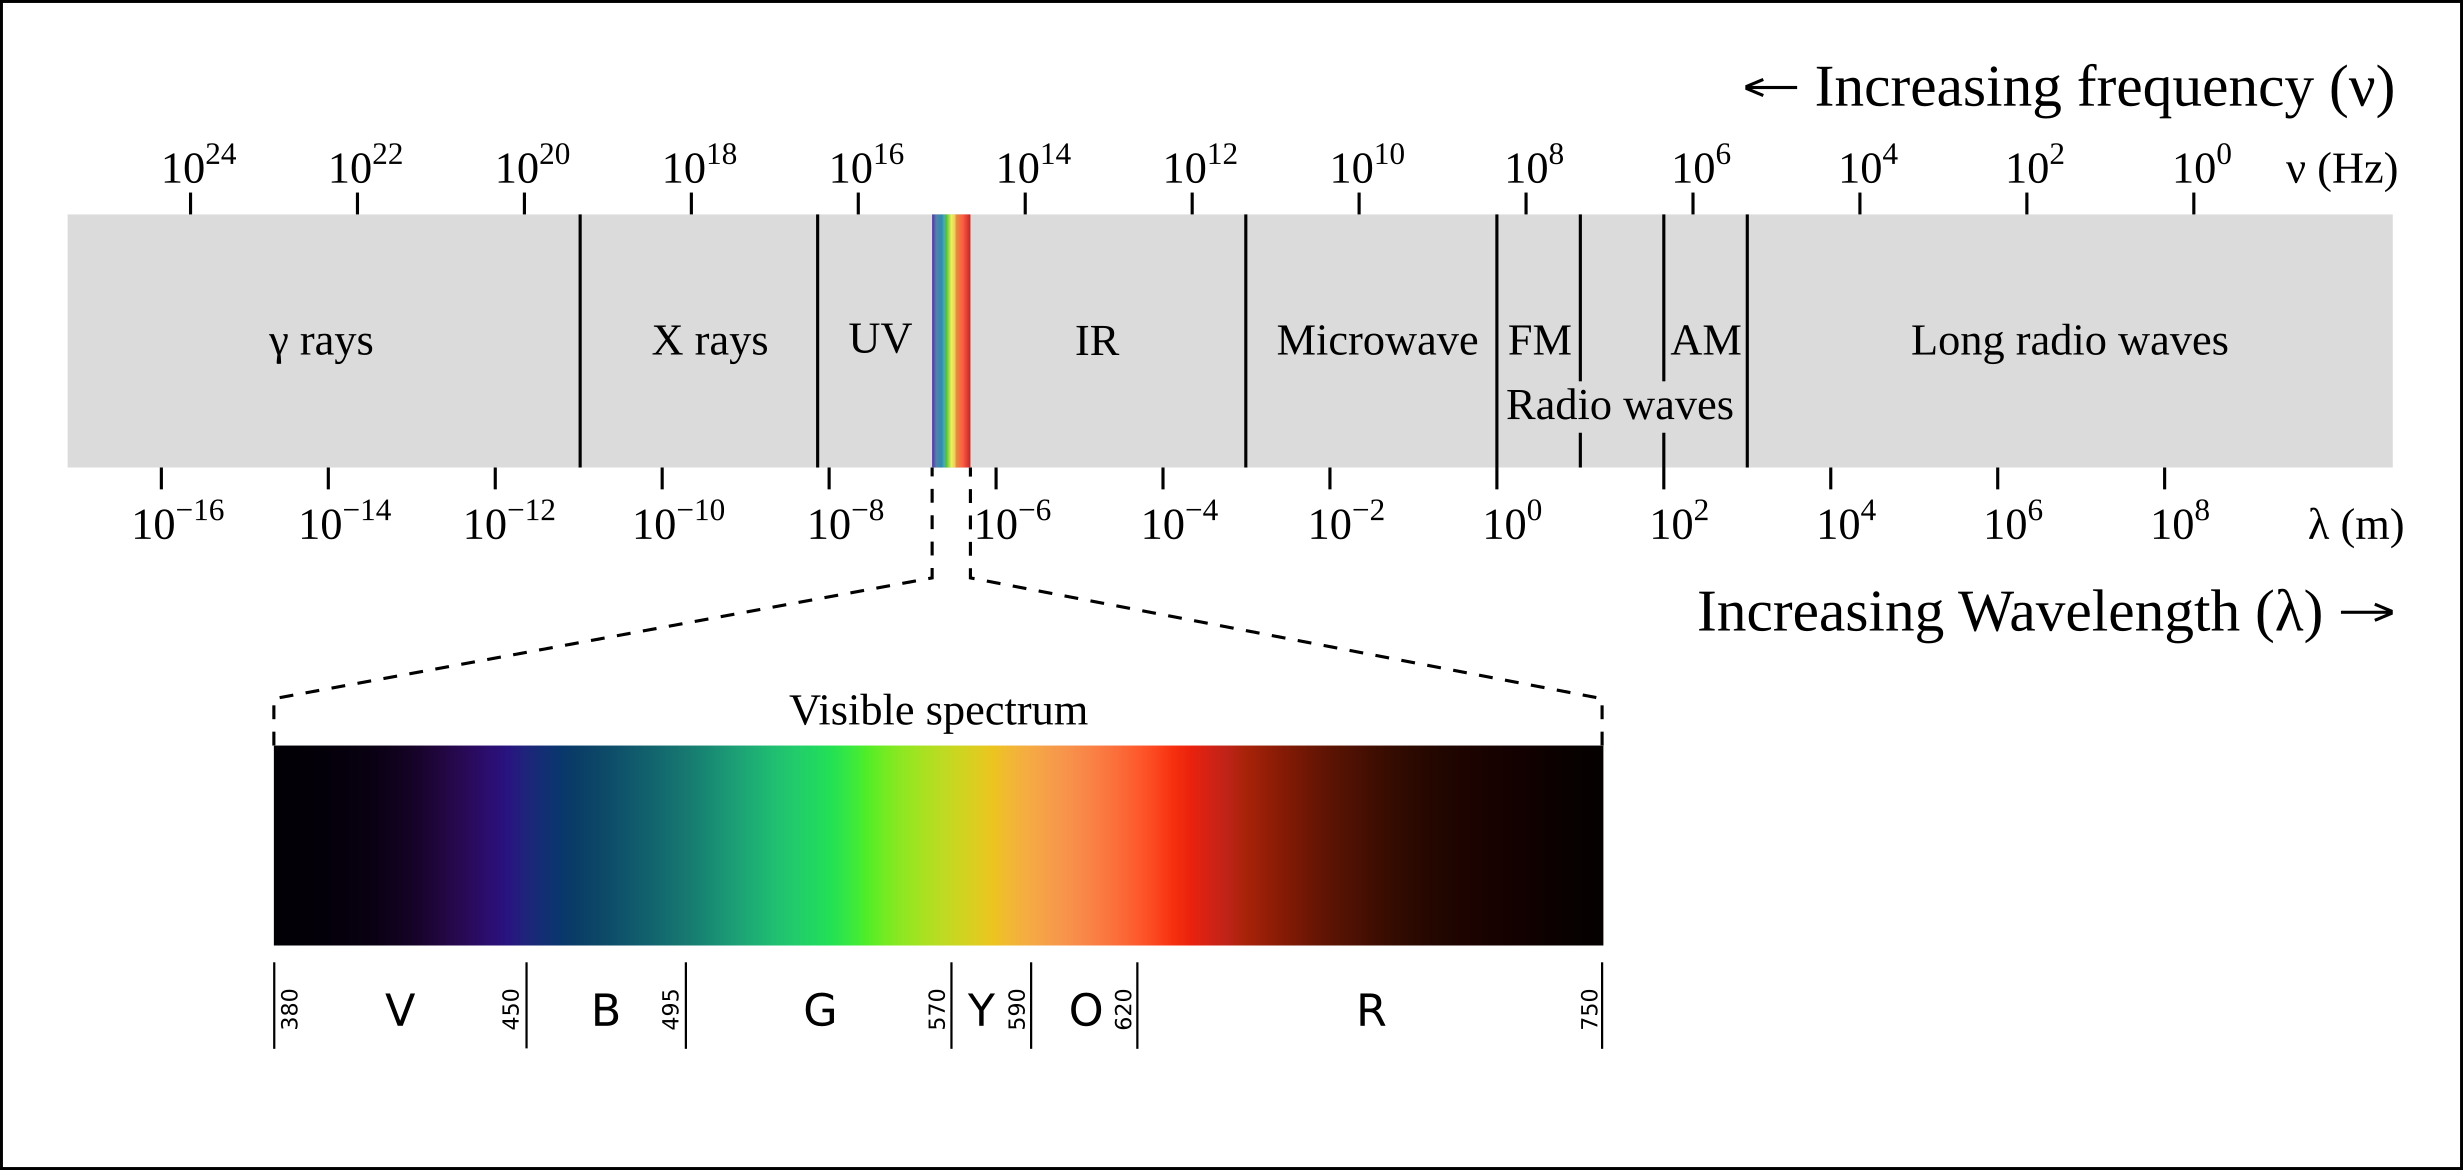
Fig. 1.18 The Electromagnetic Spectrum. Source: https://en.wikipedia.org/wiki/File:EM_spectrum.svg#
1.5.6. Mathematical Expression#
Mathematically, spectral resolution can be expressed as the width of the spectral band, \(\Delta \lambda\), which is the difference between the wavelengths at which the band begins (\(\lambda_1\)) and ends (\(\lambda_2\)):
The narrower the value of \(\Delta \lambda\), the higher the spectral resolution of the sensor. High spectral resolution allows for the discrimination between different materials and the detection of subtle changes in the Earth’s surface, which can be crucial for environmental monitoring and other remote sensing applications.
Example 1.12
Fig. 1.19 illustrates the difference between black & white film and color film in terms of their layers and sensitivity to light [Liu et al., 2022, Natural Resources Canada, 2007]:
Black & White Film: This film has a single layer that is sensitive to all colors of light (blue, green, and red). It captures images in shades of gray based on the intensity of light.
Color Film: This film has three distinct layers, each sensitive to one of the primary colors (blue, green, and red). These layers work together to capture full-color images by recording the intensity of each primary color separately.
The measurements in micrometers (\(\mu\)m) indicate the wavelength range that each layer is sensitive to, from 0.4 \(\mu\)m to 0.7 \(\mu\)m. This range covers the visible spectrum of light.

Fig. 1.19 Spectral Resolution: Distinguishing Details in the Electromagnetic Spectrum. Image Credit: . Link to the image.#
1.5.7. Resolving Power#
Resolving power is defined as the smallest difference in wavelengths that can be distinguished at a specific wavelength. Resolving power (\(R\)) is given by the formula:
where:
\(\lambda\) is the wavelength of light.
\(\Delta \lambda\) is the smallest difference in wavelengths that can be distinguished.
Example 1.13
If a spectrograph can distinguish features 0.16 nm apart at a wavelength of 1000 nm, its resolving power would be 6250. To calculate the resolving power (\(R\)) of a spectrograph, we use equation (1.6).
In the given example:
\(\lambda = 1000 \, \text{nm}\)
\(\Delta \lambda = 0.16 \, \text{nm}\)
Plugging these values into the formula:
This high resolving power indicates that the spectrograph can distinguish between two wavelengths that are very close to each other, providing detailed spectral information.
1.5.8. Spectral Resolution vs. Resolving Power#
Spectral resolution and resolving power are closely related concepts in the context of spectroscopy and remote sensing, but they refer to slightly different aspects of a spectrograph’s performance.
Spectral Resolution: Focuses on the width of the wavelength bands a sensor can detect.
Resolving Power: Quantifies the ability to distinguish between closely spaced wavelengths.
High spectral resolution implies that the sensor can detect narrow wavelength bands, which contributes to a high resolving power. Essentially, a sensor with high spectral resolution will have a high resolving power, allowing it to distinguish between very close wavelengths.
1.5.9. Practical Implications#
In practical terms, both high spectral resolution and high resolving power are desirable for applications requiring detailed spectral analysis. They enable the detection of subtle differences in the spectral signatures of materials, which is essential for accurate identification and analysis.
While spectral resolution focuses on the width of the wavelength bands a sensor can detect, resolving power quantifies the ability to distinguish between closely spaced wavelengths. Both are crucial for achieving detailed and accurate spectral analysis.