Remark
Please be aware that these lecture notes are accessible online in an ‘early access’ format. They are actively being developed, and certain sections will be further enriched to provide a comprehensive understanding of the subject matter.
2.2. Basic Definitions and Concepts#
2.2.1. Ellipsoid#
An Earth ellipsoid, also known as an Earth spheroid, is a mathematical model that closely resembles the Earth’s shape. It is characterized by:
A spheroid (ellipsoid of revolution) shape
A minor axis connecting the geographical North and South Poles
Alignment with the Earth’s axis of rotation
The ellipsoid is defined by two main parameters:
Equatorial axis (a): The longer radius at the equator
Polar axis (b): The shorter radius from the center to either pole
The difference between these axes is approximately 21 km, or 0.335% of the equatorial axis.
Fig. 2.2 illustrates an Earth ellipsoid, specifically an oblate spheroid. The longer equatorial axis (a) extends horizontally, while the shorter polar axis (b) extends vertically. The dashed line represents an auxiliary sphere with a radius equal to the equatorial axis, highlighting the difference between a perfect sphere and an ellipsoid. This visualization helps in understanding how the Earth’s shape deviates from a perfect sphere, being slightly flattened at the poles and bulging at the equator.

Fig. 2.2 Visual representation of an Earth ellipsoid. Credit: Wikipedia.org. Link to Image.#
2.2.2. The Geoid#
The geoid is a complex and highly detailed model that represents the Earth’s true shape more accurately than a simple ellipsoid. Defined as an equipotential surface of the Earth’s gravity field, the geoid closely approximates mean sea level. Essentially, it reflects the shape that the ocean surface would adopt under the influence of Earth’s gravitational pull and rotation, without the interference of other factors such as winds and tides.
The color-coded map in Fig. 2.3 illustrates the undulation of the geoid in meters, based on the EGM96 gravity model and the WGS84 reference ellipsoid. The color spectrum ranges from deep blue to red, indicating variations in geoid height from approximately -100 to +80 meters. This map employs a rectangular projection with latitude lines spanning from 75° North to 75° South and longitude lines from 180° West to 180° East. The color variations represent the irregular shape of Earth’s gravity field, which deviates from a perfect ellipsoid due to uneven mass distribution within the planet.
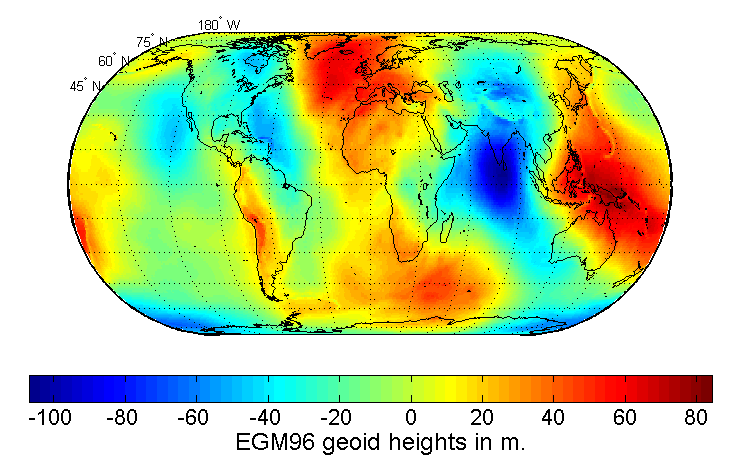
Fig. 2.3 Color-coded map showing variations in Earth’s gravitational field, with geoid heights measured in meters according to EGM96 data overlaid on the WGS84 reference ellipsoid. Credit: Wikipedia.org. Link to Image.#
The geoid exhibits several important characteristics [Freymueller and Sánchez, 2023, Kumar et al., 2023]:
Irregular Shape: Unlike the smooth mathematical ellipsoid, the geoid has an uneven, wavy surface due to the Earth’s varying mass distribution and gravitational anomalies.
Gravitational Equipotential Surface: It represents the shape that the ocean surface would take under the influence of Earth’s gravity and rotation alone. All points on the geoid have the same gravitational potential, making it a critical reference for understanding gravitational effects.
Reference for Elevation: The geoid serves as a crucial reference surface for measuring orthometric heights, which are commonly understood as heights above mean sea level.
Relationship to Mean Sea Level: The geoid closely approximates mean sea level, extending across the continents and providing a realistic baseline for elevation measurements.
Geoid Undulation: The difference between the geoid and the reference ellipsoid is termed geoid undulation or geoidal height. This undulation can vary significantly, with differences of up to 110 meters observed in various locations.
Gravity Anomalies: The shape of the geoid reflects local variations in the Earth’s gravity field, with elevations in areas of higher density and depressions in regions of lower density.
Fig. 2.4 shows a color-coded representation of the geoid, which represents mean sea level across the globe. The colors range from red to blue, indicating variations in gravitational strength and corresponding geoid heights. Red areas signify higher elevations of the geoid, while blue areas indicate lower elevations. This model helps in understanding global ocean circulation, sea level changes, and earth sciences such as geodesy and geography. It visualizes the irregular shape of Earth’s gravity field rather than its actual surface or a perfect sphere.
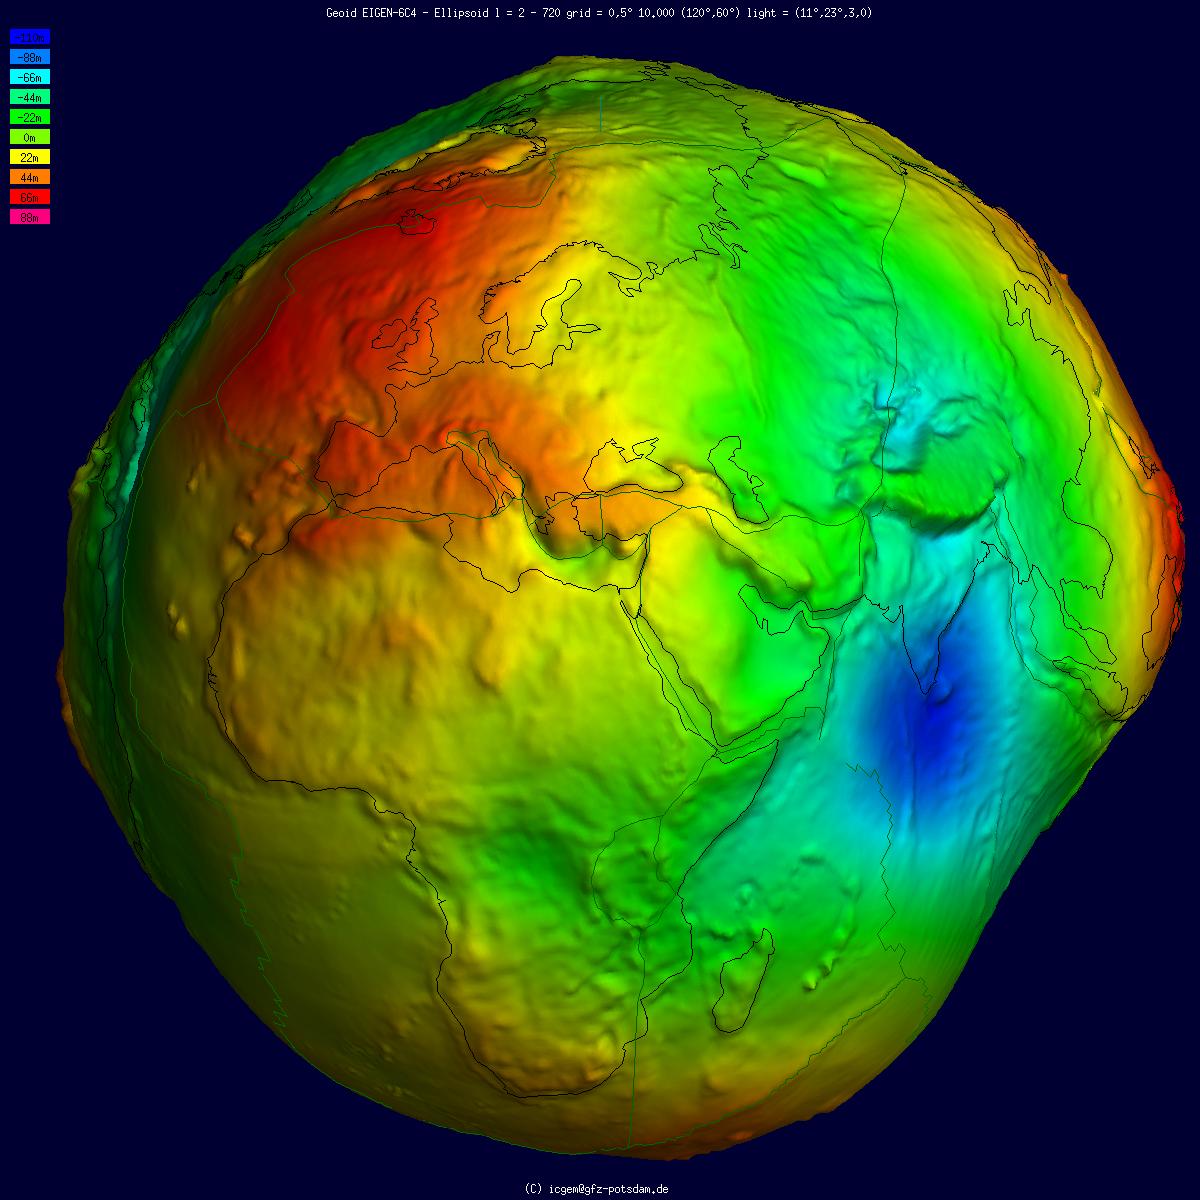
Fig. 2.4 Geoid Representation: Variations in Earth’s Gravitational Field. Credit: Wikipedia.org. Link to Image.#
Understanding the geoid is essential for several reasons [Seeber, 2008, Sjöberg and Bagherbandi, 2017]:
Accurate Elevation Measurements: The geoid provides a more precise reference for determining elevations compared to a simple ellipsoid model.
GPS Height Conversion: It plays a vital role in converting GPS-derived ellipsoidal heights into practical orthometric heights, which are more relevant for everyday applications.
Earth Science Applications: The geoid is critical for various fields, including oceanography, hydrology, and geology, as it influences water flow and sea level studies.
Improved Mapping and Surveying: The geoid enables more accurate cartography, digital terrain models, and satellite altimetry, enhancing the quality of geographic information systems.
Gravity Field Studies: It aids in the study of the Earth’s gravity field and its variations over time, contributing to our understanding of geophysical processes.
Determining the precise shape of the geoid remains a significant challenge in geodesy. Modern techniques combine satellite data from missions like GRACE and GOCE with terrestrial gravity measurements to create increasingly accurate geoid models. These advancements enhance our understanding of the Earth’s shape, gravity field, and various geophysical processes, driving progress in both scientific research and practical applications [Szelachowska et al., 2022, Tapley et al., 2019, van der Meijde et al., 2015].
2.2.3. Datum#
A datum is a reference system that defines the size and shape of the Earth and provides a foundation for calculating the positions of points on the Earth’s surface. It integrates the concepts of the ellipsoid and geoid to create a practical framework for mapping and spatial measurements [Hofmann-Wellenhof and Moritz, 2006, Seeber, 2008].
2.2.3.1. Key Components of a Datum:#
Reference Ellipsoid: A mathematically defined surface that approximates the Earth’s shape [Torge and Müller, 2012].
Origin Point: A specific point where the ellipsoid is anchored to the Earth’s surface [Seeber, 2008].
Orientation: The alignment of the ellipsoid’s axes relative to the Earth [Hofmann-Wellenhof and Moritz, 2006].
2.2.3.2. Relationship to Ellipsoid and Geoid:#
Ellipsoid Connection: The datum specifies the ellipsoid to be used and its position relative to the Earth’s center and surface [Torge and Müller, 2012].
Geoid Consideration: Although based on an ellipsoid, a datum often incorporates geoid undulations for more accurate vertical measurements [Hofmann-Wellenhof and Moritz, 2006].
Datum’s Role: A datum integrates both the ellipsoid and geoid by defining the ellipsoid’s position relative to the geoid and the Earth’s surface, allowing for accurate three-dimensional positioning by combining horizontal and vertical data [Seeber, 2008].
2.2.3.3. Types of Datums:#
Geodetic Datums:
Purpose: To accurately describe locations in terms of latitude and longitude for horizontal positioning on the Earth’s surface.
Basis: An ellipsoid that approximates the Earth’s shape, considering its equatorial bulge and polar flattening [Torge and Müller, 2012].
Components: Ellipsoid specifications, position and orientation relative to the Earth, and the datum origin.
Examples:
Geocentric Datums:
Origin at the Earth’s center of mass [Seeber, 2008].
Example: WGS84 (World Geodetic System 1984)
Used for global applications like GPS.
Local Datums:
Designed to fit a specific region of the Earth’s surface.
Example: NAD83 (North American Datum 1983)
Provides enhanced accuracy for localized regions [Hofmann-Wellenhof and Moritz, 2006].
Vertical Datums:
Purpose: To establish a reference surface for elevation measurements, used for determining heights or depths.
Basis: Typically based on mean sea level or a geoid model [Torge and Müller, 2012].
Key Feature: Defines a “zero point” from which heights are measured.
Examples:
NAVD88 (North American Vertical Datum of 1988)
EGM96 (Earth Gravitational Model 1996) [Seeber, 2008].
2.2.3.4. Importance in GIS and Mapping:#
Coordinate Reference: Datums provide the foundational framework for coordinate systems, enabling precise location representation [Hofmann-Wellenhof and Moritz, 2006].
Consistency: Ensure that all users of a particular system reference the same spatial framework [Torge and Müller, 2012].
Transformation: Facilitate conversions between different coordinate systems and datums [Seeber, 2008].
Data Integration: Allow for the accurate combination of spatial data from various sources [Hofmann-Wellenhof and Moritz, 2006].
Spatial Accuracy: Ensure that coordinates accurately reflect real-world locations [Torge and Müller, 2012].
Analysis Reliability: Support accurate measurements, distances, and area calculations [Seeber, 2008].
Global Compatibility: Enable the use of global navigation and positioning systems [Hofmann-Wellenhof and Moritz, 2006].
2.2.3.5. Practical Implications:#
Changing datums can significantly alter the coordinate values for the same physical location [Torge and Müller, 2012].
Understanding datums is crucial for accurate data integration and analysis in GIS [Seeber, 2008].
Although modern GIS software often handles datum transformations automatically, users must understand the underlying concepts to ensure accuracy [Hofmann-Wellenhof and Moritz, 2006].
Datums are essential for applications including mapping, navigation, urban planning, environmental monitoring, and scientific research [Torge and Müller, 2012].
2.2.4. Meridians and Parallels#
Meridians and parallels form the grid system used in geographic coordinate systems to precisely locate any point on Earth’s surface.
Meridians: Meridians are imaginary vertical lines that run from the North Pole to the South Pole. They are used to measure longitude, which indicates how far east or west a location is from the Prime Meridian.
Meridians are half-circles, with each meridian having an anti-meridian on the opposite side of the globe.
They converge at the poles and are farthest apart at the equator.
Longitude is measured in degrees, from 0° to 180° east or west of the Prime Meridian.
Prime Meridian:
Located at 0° longitude, passing through Greenwich, England (shown as the red line in Fig. 2.5).
Serves as the reference point for measuring longitude east and west.
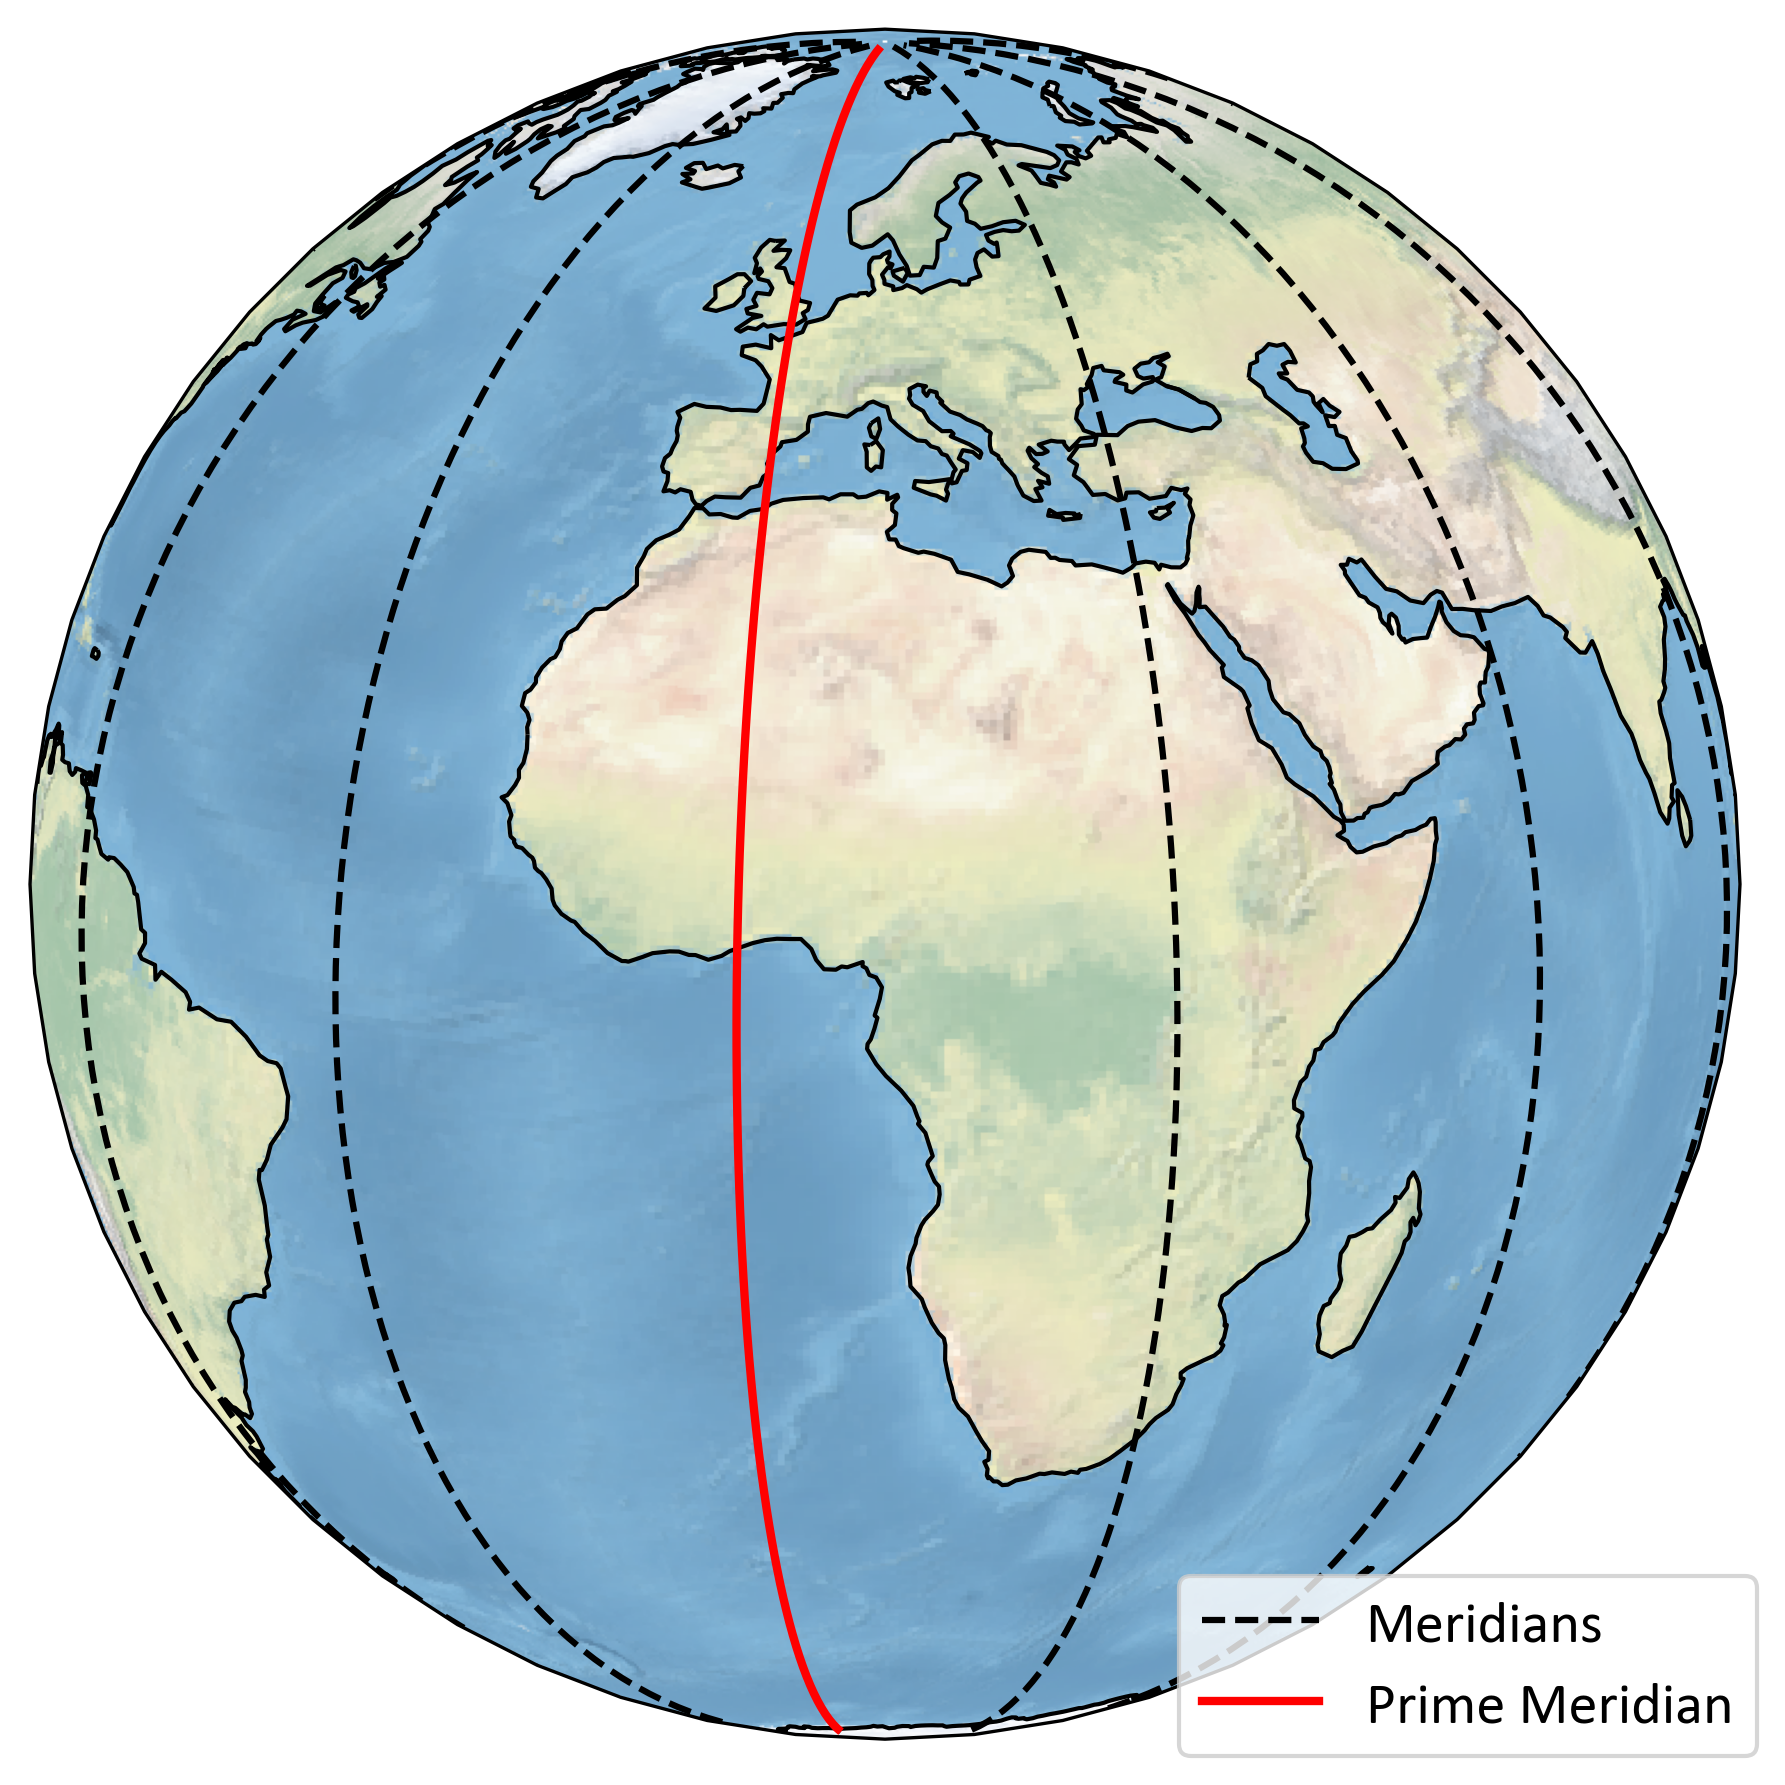
Fig. 2.5 Meridians and Prime Meridian.#
Parallels: Parallels are imaginary horizontal lines that circle the globe parallel to the equator. They are used to measure latitude, which indicates how far north or south a location is from the equator.
Parallels are complete circles that gradually decrease in size from the equator towards the poles.
They are always equidistant from each other.
Latitude is measured in degrees, from 0° at the equator to 90° at the poles (north or south).
Equator:
The largest parallel, located at 0° latitude (shown as the red line in Fig. 2.6).
Divides the Earth into the Northern and Southern Hemispheres.
Has a constant distance of approximately 40,075 km (24,901 miles) around the globe.
Other Notable Parallels:
Tropic of Cancer (23.5°N) and Tropic of Capricorn (23.5°S): Mark the northernmost and southernmost latitudes where the Sun can appear directly overhead.
Arctic Circle (66.5°N) and Antarctic Circle (66.5°S): Mark the southernmost and northernmost latitudes where 24-hour daylight or darkness can occur (shown as the blue lines in Fig. 2.6).
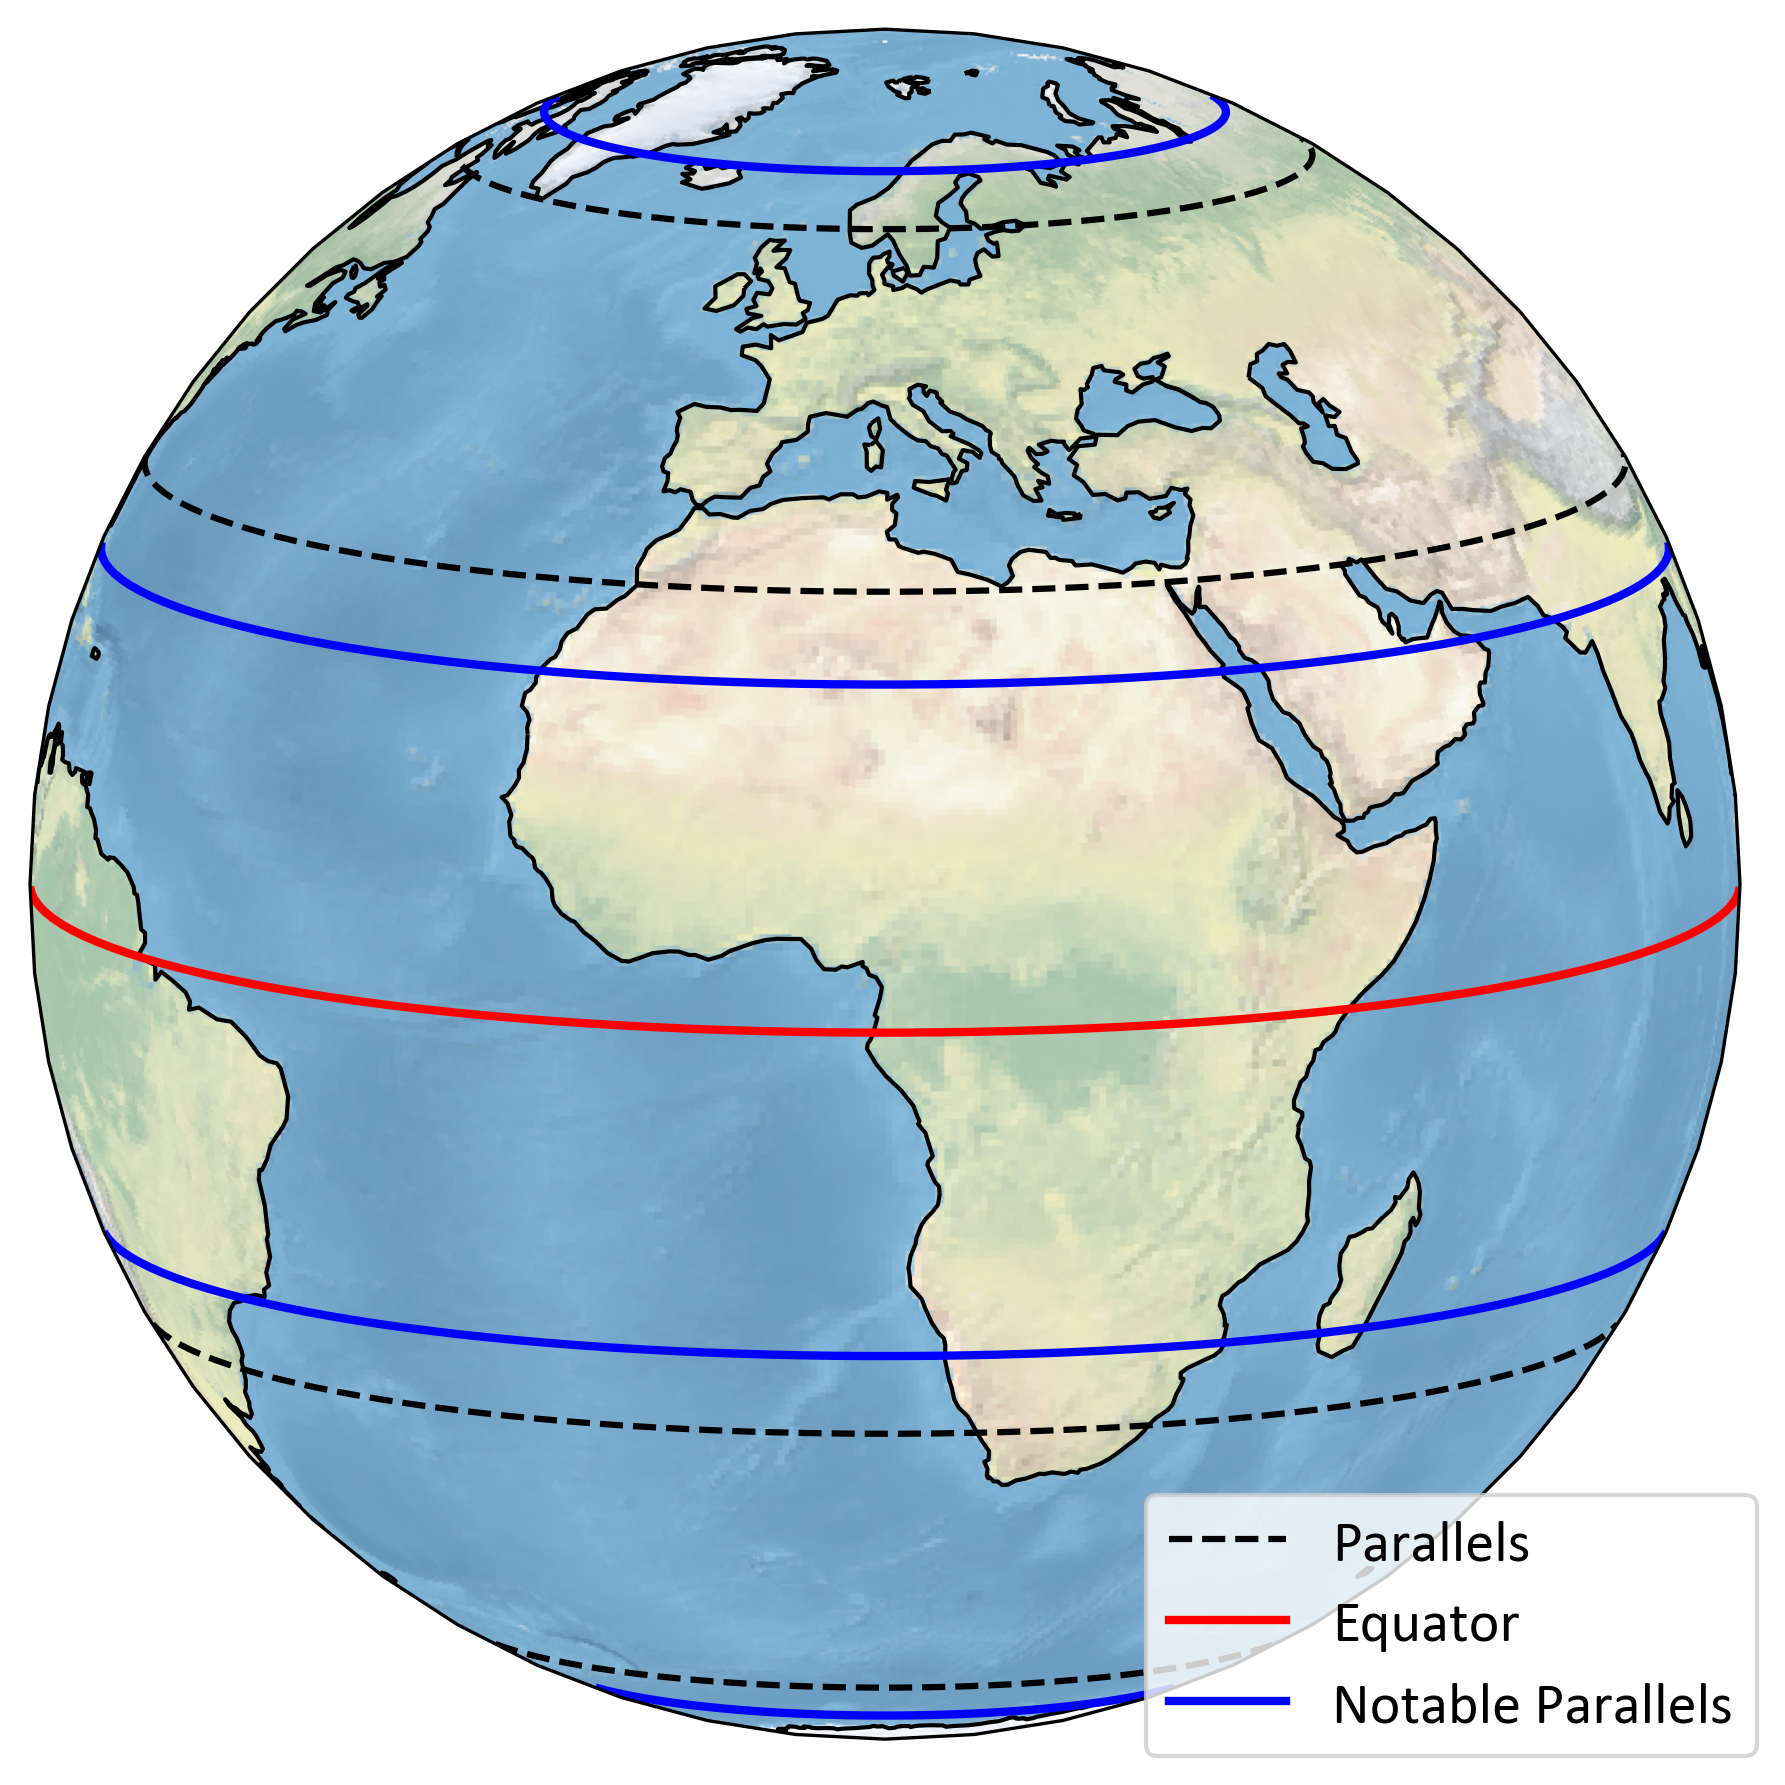
Fig. 2.6 Meridians, Prime Meridian, and International Date Line.#
2.2.5. Latitude (\(\phi\)) and Longitude (\(\lambda\))#
In the geographic coordinate system, locations on Earth are specified using two angular measurements: latitude (\(\phi\)) and longitude (\(\lambda\)).
Latitude (\(\phi\)): Latitude, denoted by the Greek letter phi (\(\phi\)), measures the angular distance north or south of the Earth’s equator. It is expressed in degrees, ranging from \(-90°\) to \(+90°\).
\(\phi = 0°\) represents the equator
\(\phi = +90°\) corresponds to the North Pole
\(\phi = -90°\) corresponds to the South Pole
Lines of constant latitude are called parallels. They form circles on the Earth’s surface that are parallel to the equator.
Positive values (\(\phi > 0°\)) indicate locations in the Northern Hemisphere (N).
Negative values (\(\phi < 0°\)) indicate locations in the Southern Hemisphere (S).
Longitude (\(\lambda\)): Longitude, denoted by the Greek letter lambda (\(\lambda\)), measures the angular distance east or west of the prime meridian. It is expressed in degrees, ranging from \(-180°\) to \(+180°\).
\(\lambda = 0°\) represents the prime meridian (passing through Greenwich, UK)
\(\lambda = +180°\) and \(\lambda = -180°\) represent the International Date Line
Lines of constant longitude are called meridians. They form great circles that converge at the poles.
Positive values (\(\lambda > 0°\)) indicate locations in the Eastern Hemisphere (E).
Negative values (\(\lambda < 0°\)) indicate locations in the Western Hemisphere (W).
Fig. 2.7 visually explains the concepts of latitude (\(\phi\)) and longitude (\(\lambda\)) in the geographic coordinate system.
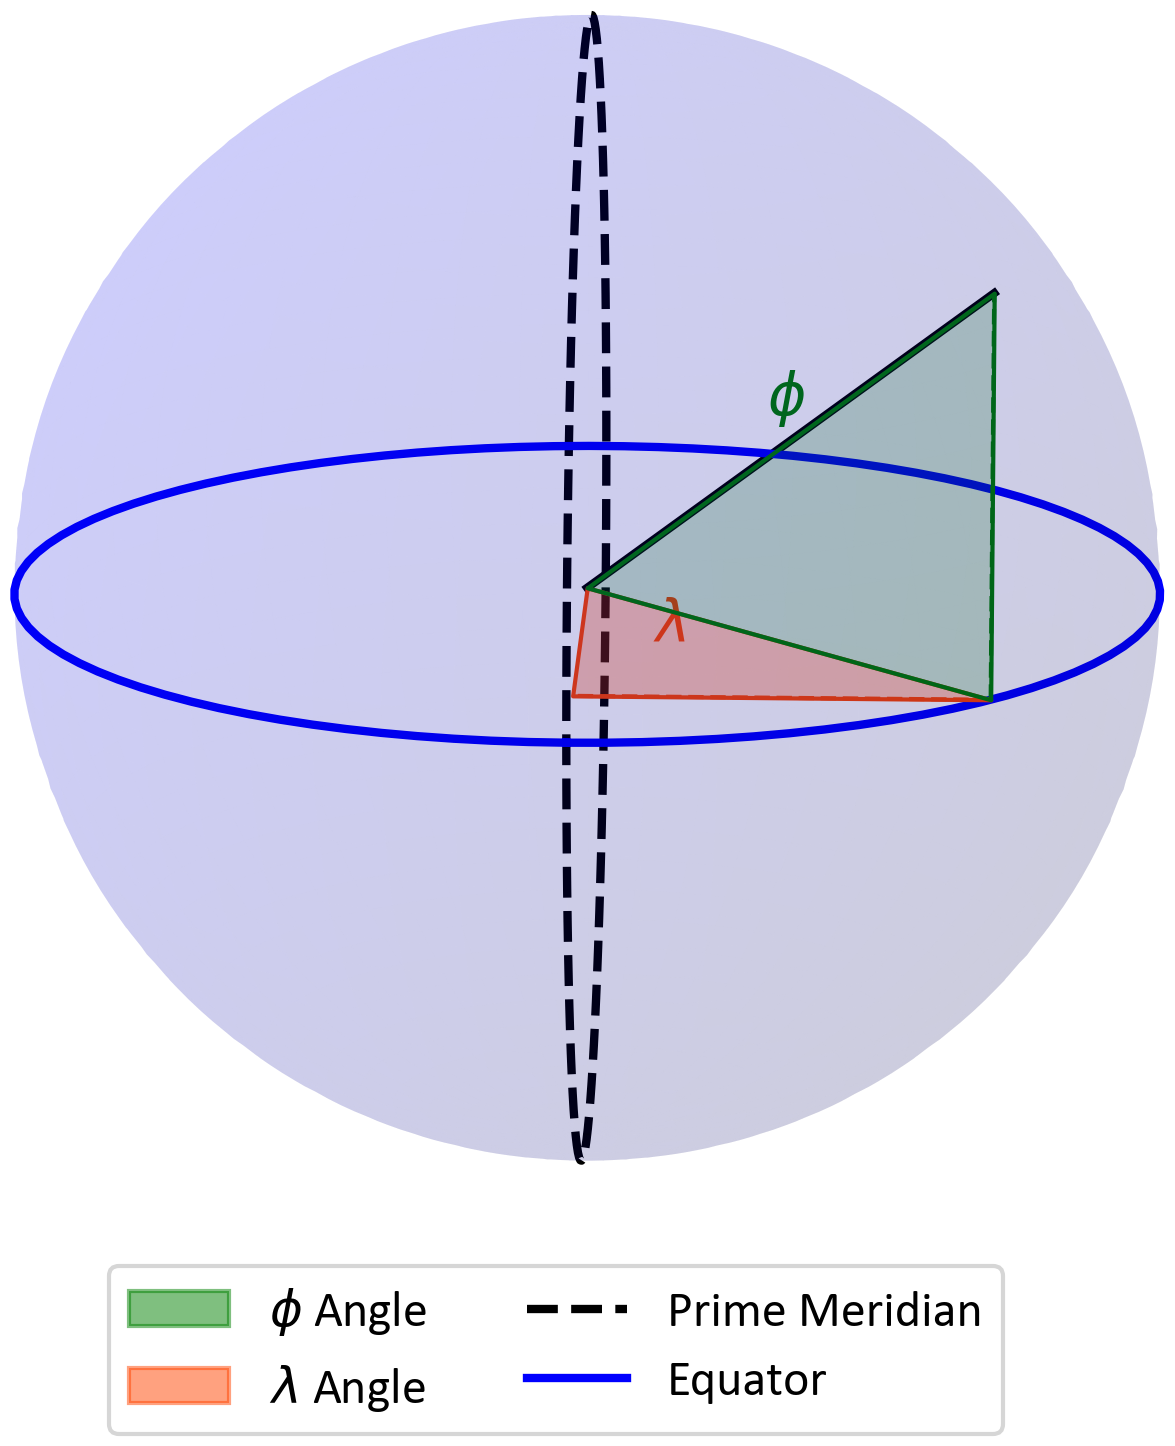
Fig. 2.7 Visualization of latitude (\(\phi\)) and longitude (\(\lambda\)).#
2.2.6. Degrees, Minutes, and Seconds (DMS)#
Degrees, Minutes, and Seconds (DMS) is a traditional format for expressing geographic coordinates, commonly used in navigation and mapping. This system divides a degree into smaller units to provide a more precise location on the Earth’s surface.
Structure of DMS:
Degrees (°): The largest unit, representing the primary division of a circle. There are 360 degrees in a full circle.
Minutes (‘): Each degree is divided into 60 minutes.
Seconds (“): Each minute is further divided into 60 seconds.
The relationship can be summarized as:
Common Formats:
DMS Format: Expressed as degrees, minutes, and seconds (DD° MM’ SS.S”).
Degrees and Decimal Minutes (DMM): Expressed as degrees and decimal minutes (DD° MM.MMM’).
Decimal Degrees (DD): Expressed as decimal degrees (DD.DDDDDD°).
Conversion Between Formats:
To Convert DMS to Decimal Degrees (DD):
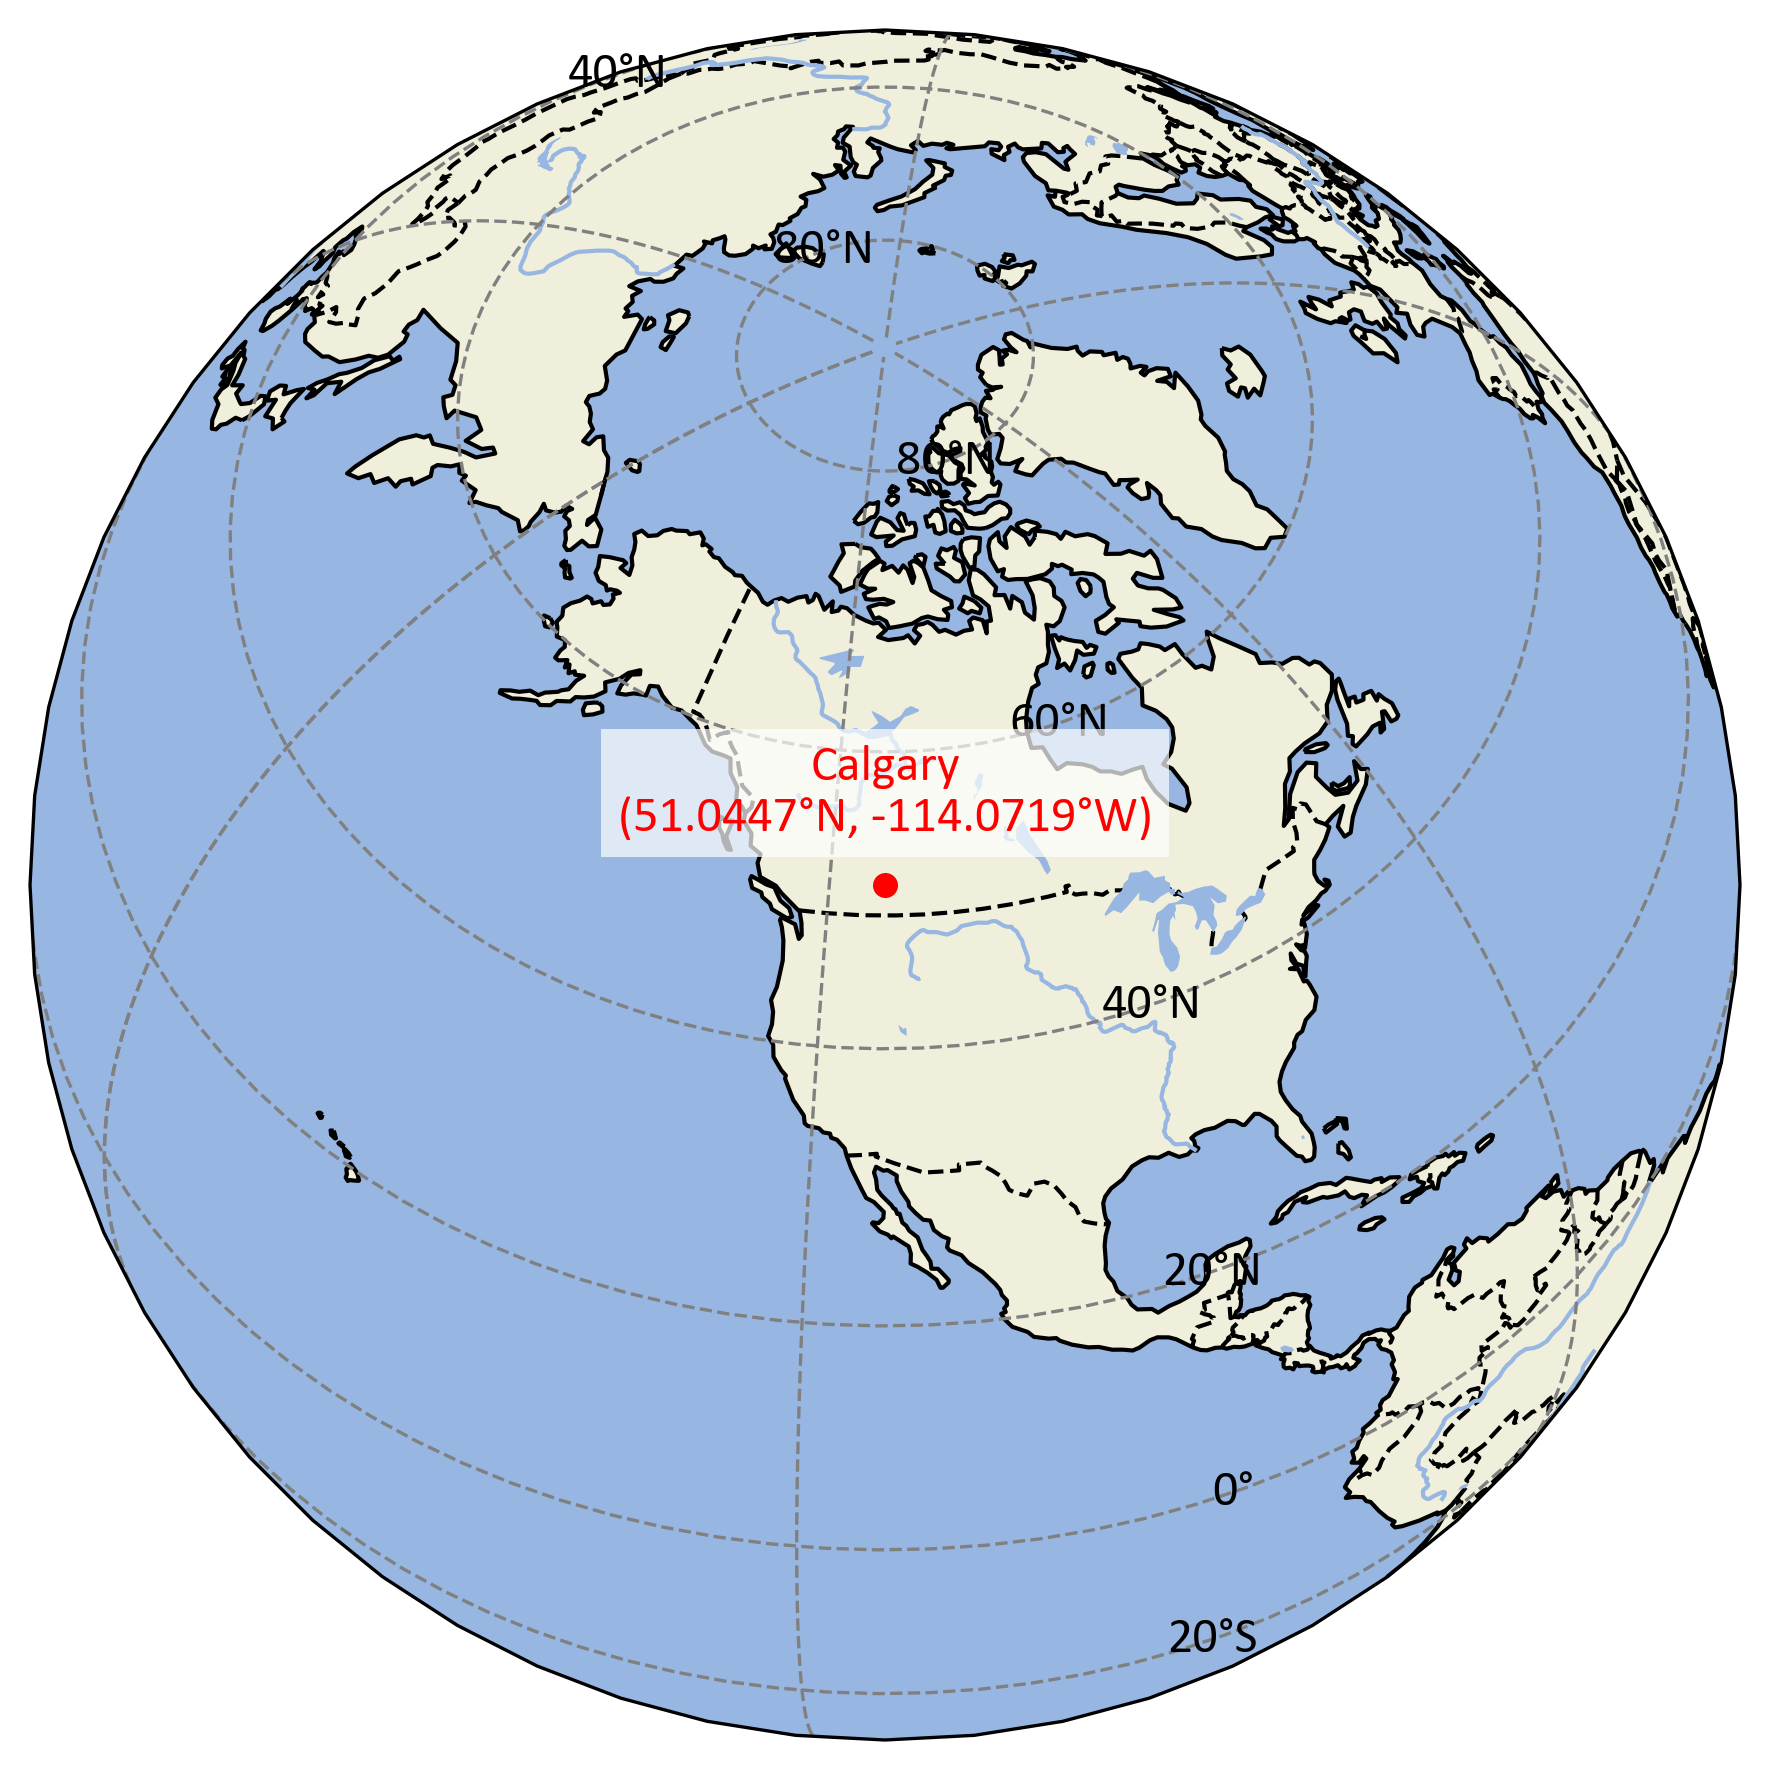
(2.2)#\[\begin{equation} \text{DD} = \text{Degrees} + \left(\dfrac{\text{Minutes}}{60}\right) + \left(\dfrac{\text{Seconds}}{3600}\right) \end{equation}\]Example: Given: 51° 2’ 40.92”
\[\begin{equation*} \text{DD} = 51 + \left(\dfrac{2}{60}\right) + \left(\dfrac{40.92}{3600}\right) \approx 51.0447° \end{equation*}\]To Convert Decimal Degrees (DD) to DMS:
Step 1: The whole number part is the degrees.
Step 2: Multiply the decimal part by 60 to get minutes:
(2.3)#\[\begin{equation} \text{Minutes} = (\text{DD} - \text{Degrees}) \times 60 \end{equation}\]Step 3: Multiply the remaining decimal part by 60 to get seconds:
(2.4)#\[\begin{equation} \text{Seconds} = (\text{Remaining Decimal}) \times 60 \end{equation}\]
Example: Given: 51.0447°
\[\begin{equation*} \text{Degrees} = 51° \end{equation*}\]\[\begin{equation*} \text{Minutes} = (0.0447) \times 60 \approx 2.682' \end{equation*}\]\[\begin{equation*} \text{Seconds} = (0.682) \times 60 \approx 40.92'' \end{equation*}\]Result: 51° 2’ 40.92”
To Convert Decimal Degrees (DD) to Degrees and Decimal Minutes (DMM):
Step 1: The whole number part is the degrees.
Step 2: Multiply the decimal part by 60 to get decimal minutes:
(2.5)#\[\begin{equation} \text{Decimal Minutes} = (\text{DD} - \text{Degrees}) \times 60 \end{equation}\]
Example: Given: 51.0447°
\[\begin{equation*} \text{Degrees} = 51° \end{equation*}\]\[\begin{equation*} \text{Decimal Minutes} = (0.0447) \times 60 \approx 2.682' \end{equation*}\]Result: 51° 2.682’
Usage Considerations:
While DMS is still prevalent in many contexts, particularly in traditional navigation, modern applications often prefer Decimal Degrees due to their ease of use in calculations and compatibility with digital systems.