Remark
Please be aware that these lecture notes are accessible online in an ‘early access’ format. They are actively being developed, and certain sections will be further enriched to provide a comprehensive understanding of the subject matter.
2.4. Map Projections#
Maps might seem simple, but they are quite complex, often containing multiple layers of information. We can create interactive maps by layering different datasets, but we must be cautious. Familiarity with maps doesn’t guarantee accuracy or understanding. Projections are a prime example. Maps are essential tools for navigation, spatial analysis, and decision-making in various fields, from urban planning to environmental management. However, creating accurate representations of our three-dimensional world on a two-dimensional surface presents significant challenges.
The Earth isn’t a perfect sphere; it’s an oblate spheroid due to its chemical composition and the centrifugal force from its rotation, making it bulge at the equator. This shape is technically an ellipsoid, with a shorter circumference around the poles than the equator. To create a two-dimensional map, we use a geographic coordinate system with latitude and longitude lines, called a graticule, to project this imperfect sphere onto a flat surface. These projections simplify complex factors like changes in Earth’s gravitational field due to topography, known as the geoid. It’s crucial to recognize that the entire world can’t be accurately represented on a flat surface without some distortion [McClain, 2022]. Despite these challenges, map projections are necessary to create usable maps that help us understand spatial relationships, analyze geographic data, and make informed decisions about our world.
2.4.1. Types of Map Projections#
Map projections are methods used to represent the Earth’s curved surface on a flat map. Each projection type has distinct characteristics, advantages, and limitations. The main types of map projections include [Grafarend et al., 2014, Lapaine and Usery, 2017, ICSM, 2024]:
Cylindrical Projections: Generated by wrapping a cylinder around the globe, these projections are useful for equatorial regions but often distort areas at higher latitudes.
Examples: Mercator, Plate Carrée, and Central Cylindrical.
Fig. 2.13 illustrates the Cylindrical Map Projection. The cylinder is then unrolled into a flat map.

Fig. 2.13 Cylindrical Map Projection. Credit: icsm.gov.au. Link to Image.#
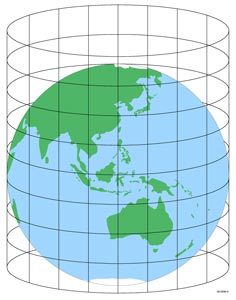
Conic Projections: These involve projecting the Earth’s surface onto a cone, making them well-suited for mid-latitude regions, balancing shape and area distortion.
Examples: Albers Equal Area and Lambert Conformal Conic.
Fig. 2.14 illustrates the Conic Map Projection. The cone is then unrolled into a flat map.
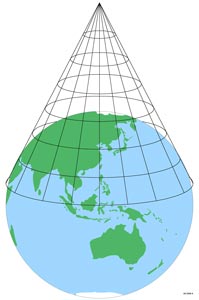
Fig. 2.14 Cylindrical Map Projection. Credit: icsm.gov.au. Link to Image.#
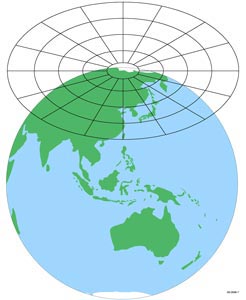
Azimuthal (or Planar) Projections: In these projections, the Earth is mapped onto a plane, often used for polar regions and for displaying great circle routes.
Examples: Stereographic, Orthographic, and Azimuthal Equidistant.
Fig. 2.15 illustrates the Azimuthal (Planar) Map Projection.

Fig. 2.15 Cylindrical Map Projection. Credit: icsm.gov.au. Link to Image.#
Each of these projection types handles the “unrolling” of the globe differently, which leads to various patterns of distortion in area, shape, distance, or direction. The choice of projection depends on the specific needs of the map and the region being represented.
2.4.2. Challenges of Map Projections#
While map projections are essential for representing our three-dimensional world on two-dimensional surfaces, they come with inherent challenges. The fundamental issue is that it’s impossible to flatten a spherical surface onto a plane without introducing some form of distortion[Baselga and Olsen, 2021, Usery, 2017]. Each projection type sacrifices certain geographic properties to preserve others, leading to inevitable trade-offs between accuracy in shape, area, distance, and direction [Baselga and Olsen, 2021, Usery, 2017]. For instance, the popular Mercator projection preserves angles but significantly distorts area, especially near the poles. Cartographers and GIS professionals must carefully consider these challenges when selecting projections, balancing the specific needs of their maps with the inherent limitations of flattening a globe. Understanding these challenges is crucial for accurate spatial analysis, decision-making, and communication of geographic information.
2.4.3. Projection Aspect#
The aspect of a map projection refers to how the projection surface—whether cylindrical, conic, or planar—is oriented relative to the Earth. This orientation is crucial as it significantly influences the distribution of distortion across the resulting map. There are three main aspects to consider: normal, transverse, and oblique [Grafarend et al., 2014].
In the normal aspect, the axis of symmetry of the projection surface aligns with the Earth’s rotational axis, which runs from the North Pole to the South Pole. For example, a typical Mercator projection operates in this aspect, with the cylindrical surface wrapped around the Earth so that it touches at the equator. This configuration results in meridians appearing as straight vertical lines and parallels as straight horizontal lines, creating a symmetrical distortion pattern around the equator.
Fig. 2.16 illustrates the normal aspect of map projections.
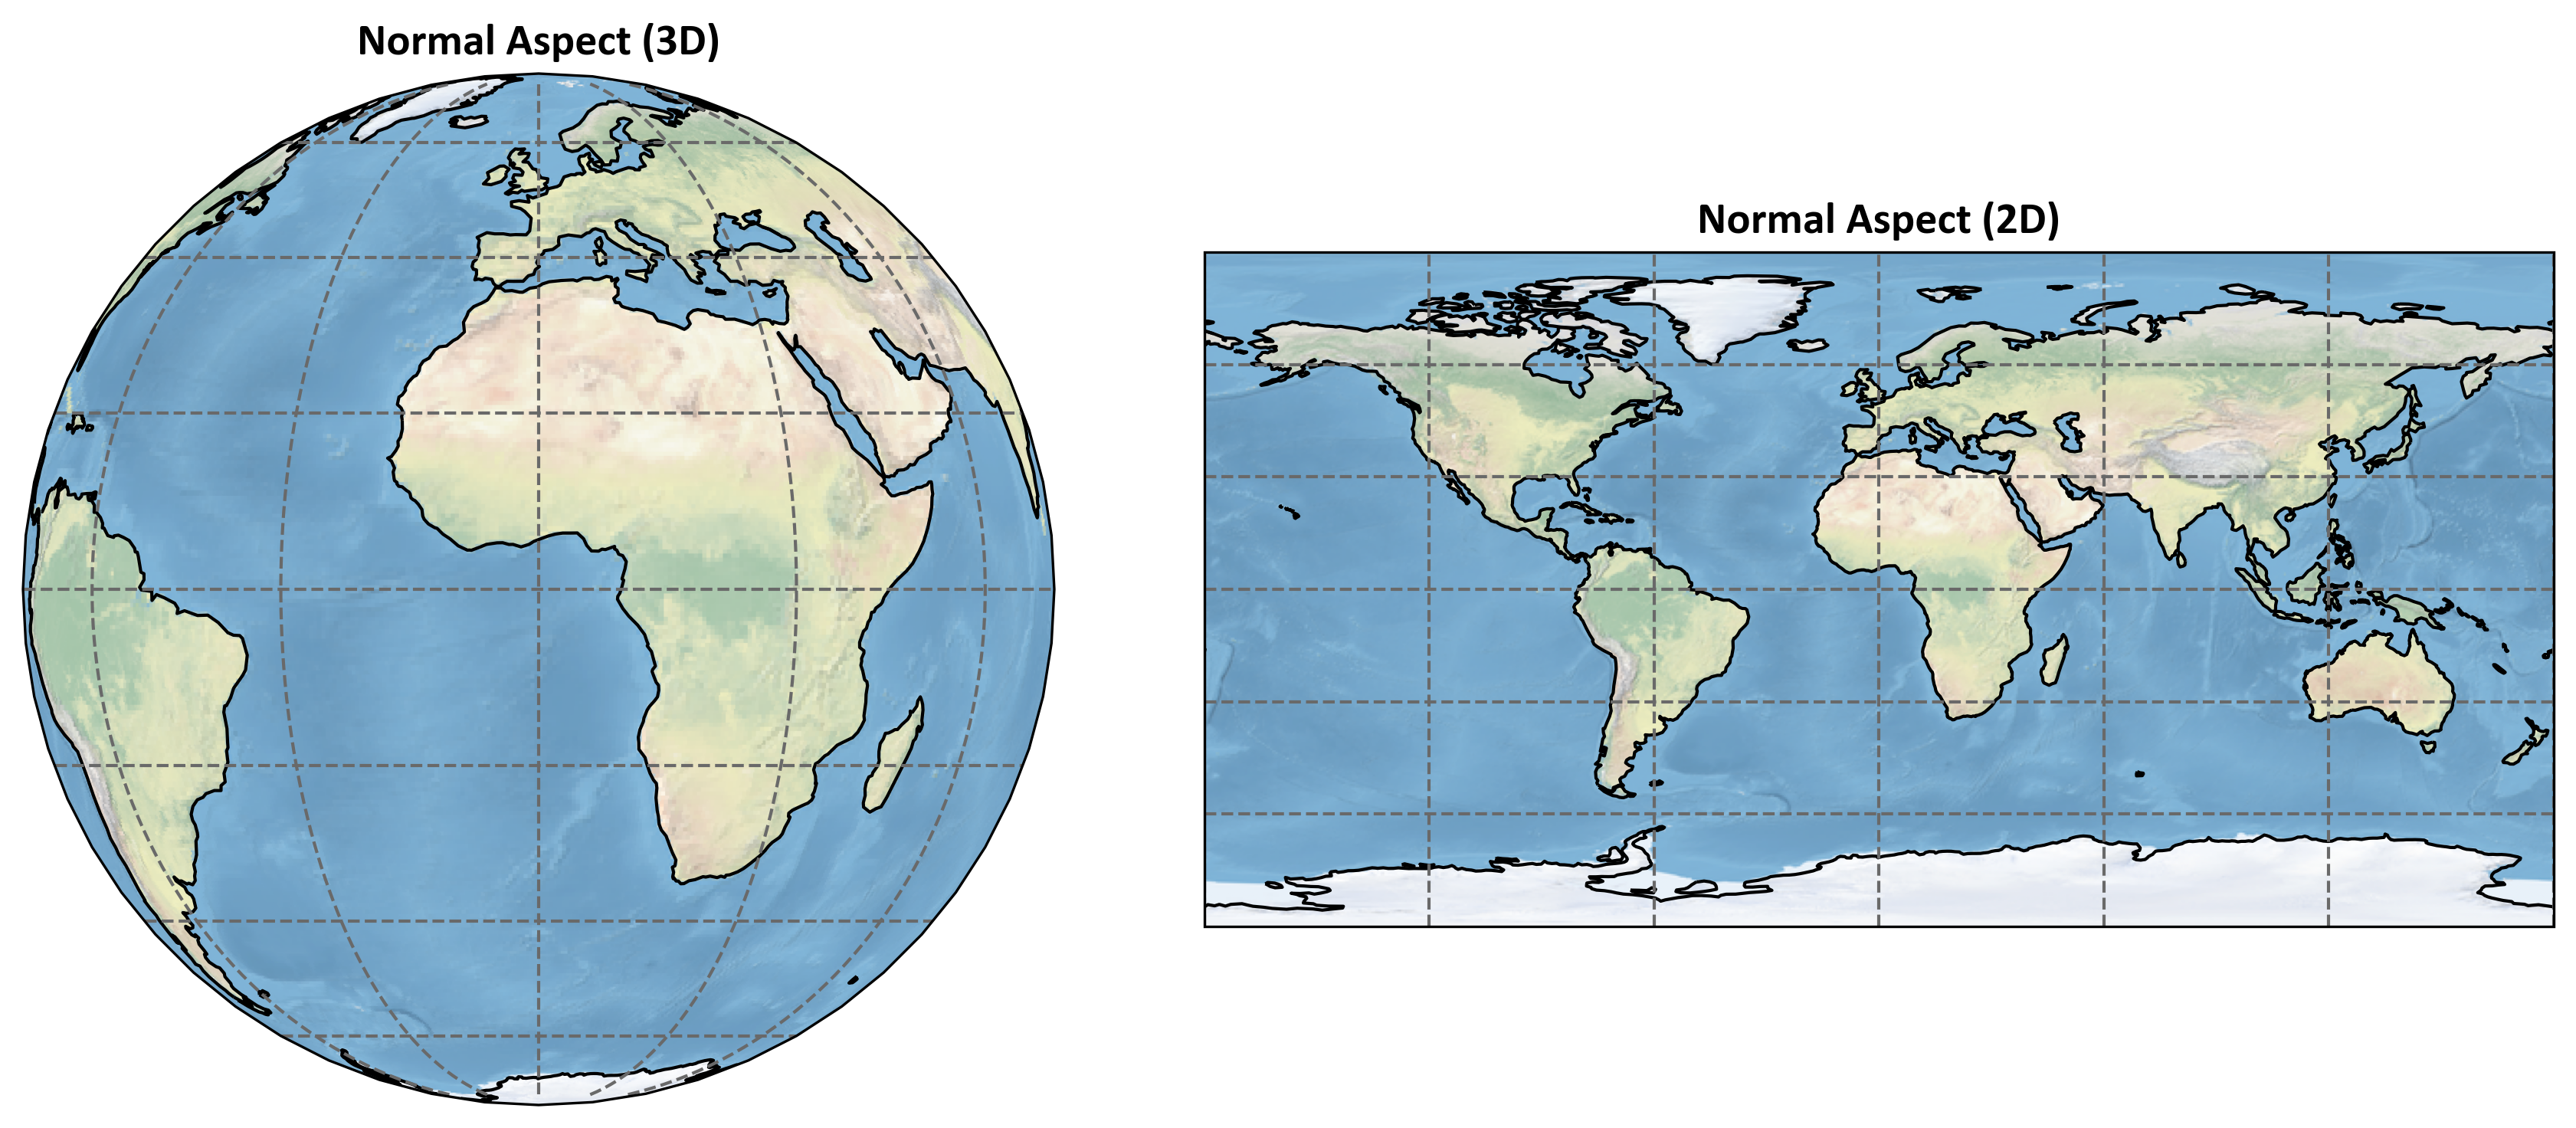
Fig. 2.16 Normal aspect of map projection: 3D globe (left) and 2D map (right).#
The transverse aspect involves rotating the projection surface 90 degrees from the normal aspect. In this case, the axis of the cylinder lies along the equator, as seen in the Transverse Mercator projection. This orientation allows the line of least distortion to run north-south, making it particularly useful for mapping areas with a north-south orientation. It is often employed for topographic maps and the Universal Transverse Mercator (UTM) coordinate system, where accurate representation of north-south regions is essential.
Fig. 2.17 shows the transverse aspect of map projections.
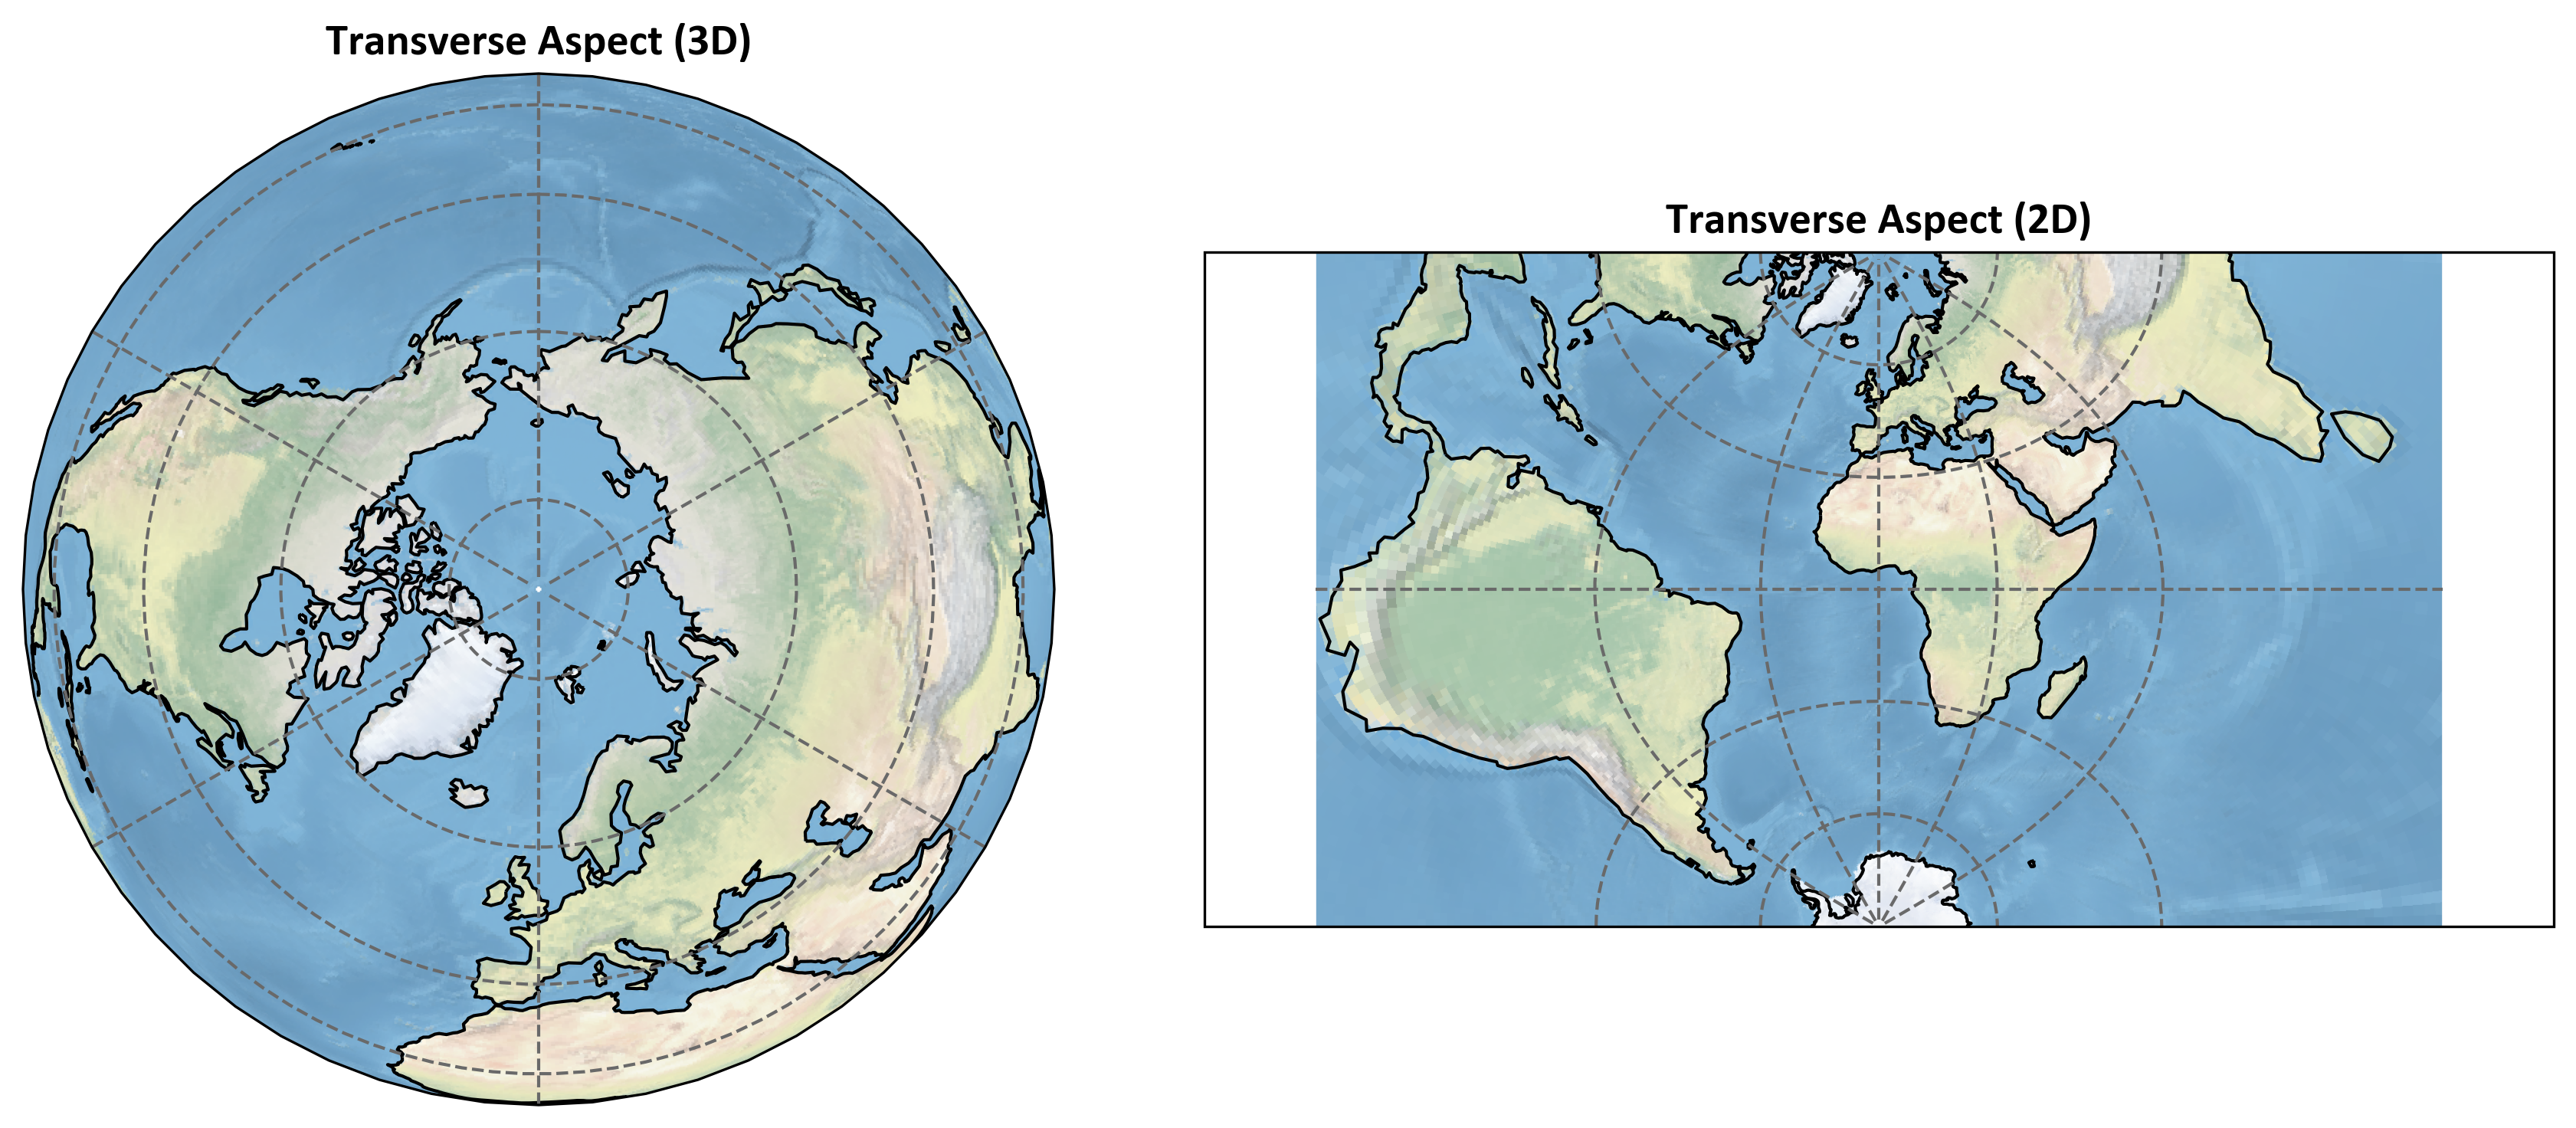
Fig. 2.17 Transverse aspect of map projection: 3D globe (left) and 2D map (right).#
The oblique aspect is characterized by the projection surface being tilted at an angle between the normal and transverse aspects. This allows for custom projections that minimize distortion for specific regions or routes. For instance, an Oblique Mercator projection may have its line of least distortion running diagonally across the map. While this aspect can be complex to construct, it offers the flexibility needed for mapping areas that do not align well with the equator or a meridian.
Fig. 2.18 demonstrates the oblique aspect of map projections.
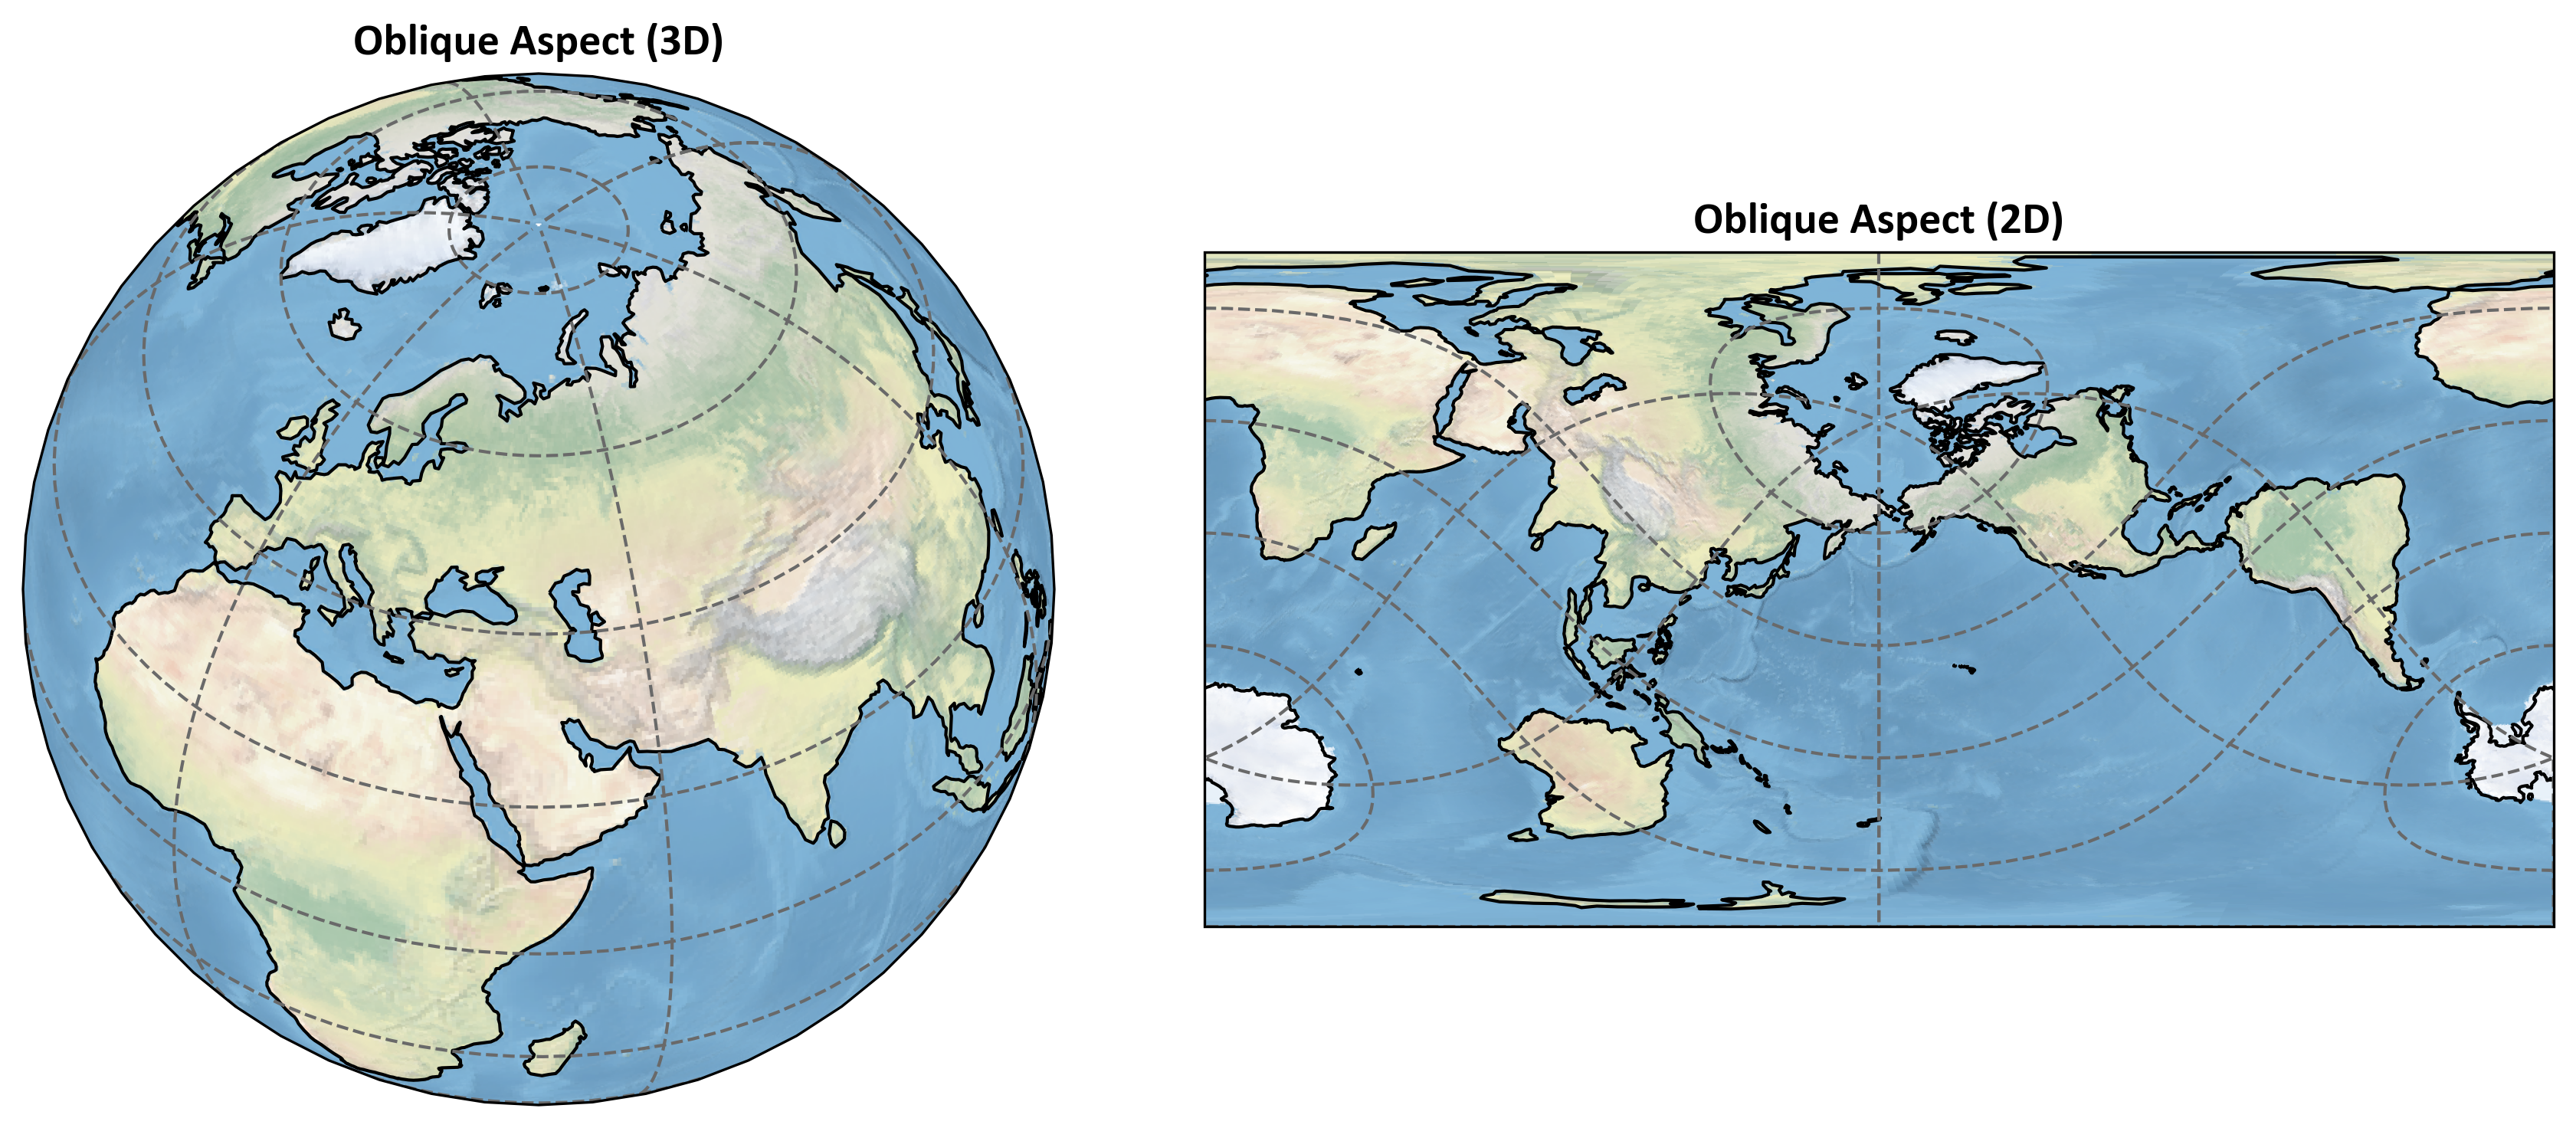
Fig. 2.18 Oblique aspect of map projection: 3D globe (left) and 2D map (right).#
Overall, the choice of aspect plays a vital role in determining how distortions are distributed across the map. It allows cartographers to center the area of least distortion on specific regions of interest, creating unique patterns that can be tailored for specialized applications. By understanding projection aspects, mapmakers can effectively balance accuracy and usability, ensuring that their maps serve their intended purposes while presenting geographical relationships in a clear and meaningful way.
2.4.4. Projection Methods: Tangent vs. Secant#
The way a projection surface (cylinder, cone, or plane) intersects with the globe is crucial in determining the characteristics of the resulting map projection. There are two primary methods: tangent and secant. Each method has distinct properties that affect the distribution of distortion across the map [Harvey, 2015, Piovan, 2020].
2.4.4.1. Tangent Method#
In the tangent method, the projection surface touches the globe at a single point (for planar projections) or along a single line (for cylindrical and conic projections). This contact creates an area of minimal distortion at the point or line of tangency. However, as you move away from this area, the distortion increases rapidly [Lee, 2001, McDonnell, 1995]. As shown in Fig. 2.19 (a), the Orthographic projection illustrates the tangent method, where the globe touches the projection surface along a single line, resulting in minimal distortion near the point of tangency.
For instance, in a tangent cylindrical projection, the cylinder might touch the Earth along the equator. The map would be most accurate near the equator, but distortion would increase significantly towards the poles. Similarly, a tangent conic projection might touch the Earth along a single parallel of latitude, with distortion increasing as you move north or south of this line.
The tangent method is useful when you need to minimize distortion in a specific area, such as along a particular latitude for a regional map. However, it can lead to severe distortions in areas far from the point or line of tangency.
2.4.4.2. Secant Method#
The secant method involves the projection surface intersecting or cutting through the globe. For cylindrical and conic projections, this creates two lines of intersection rather than a single line of tangency. This approach often results in less overall distortion across the map because it distributes the error more evenly [Lapaine and Frančula, 2022, Salomon, 2006]. Fig. 2.19 (b) demonstrates this with an Orthographic projection that highlights two standard parallels, showing the regions of minimal distortion.
In a secant cylindrical projection, for instance, the cylinder might intersect the Earth at two parallels of latitude, one north and one south of the equator. This creates two lines of true scale (where the map is most accurate), with slight compression between these lines and slight expansion beyond them. The result is a more balanced distribution of distortion across the map.
The secant method is particularly useful for mapping larger areas or when you need to minimize overall distortion across the entire map. It sacrifices perfect accuracy along a single line in favor of better accuracy across a wider region.
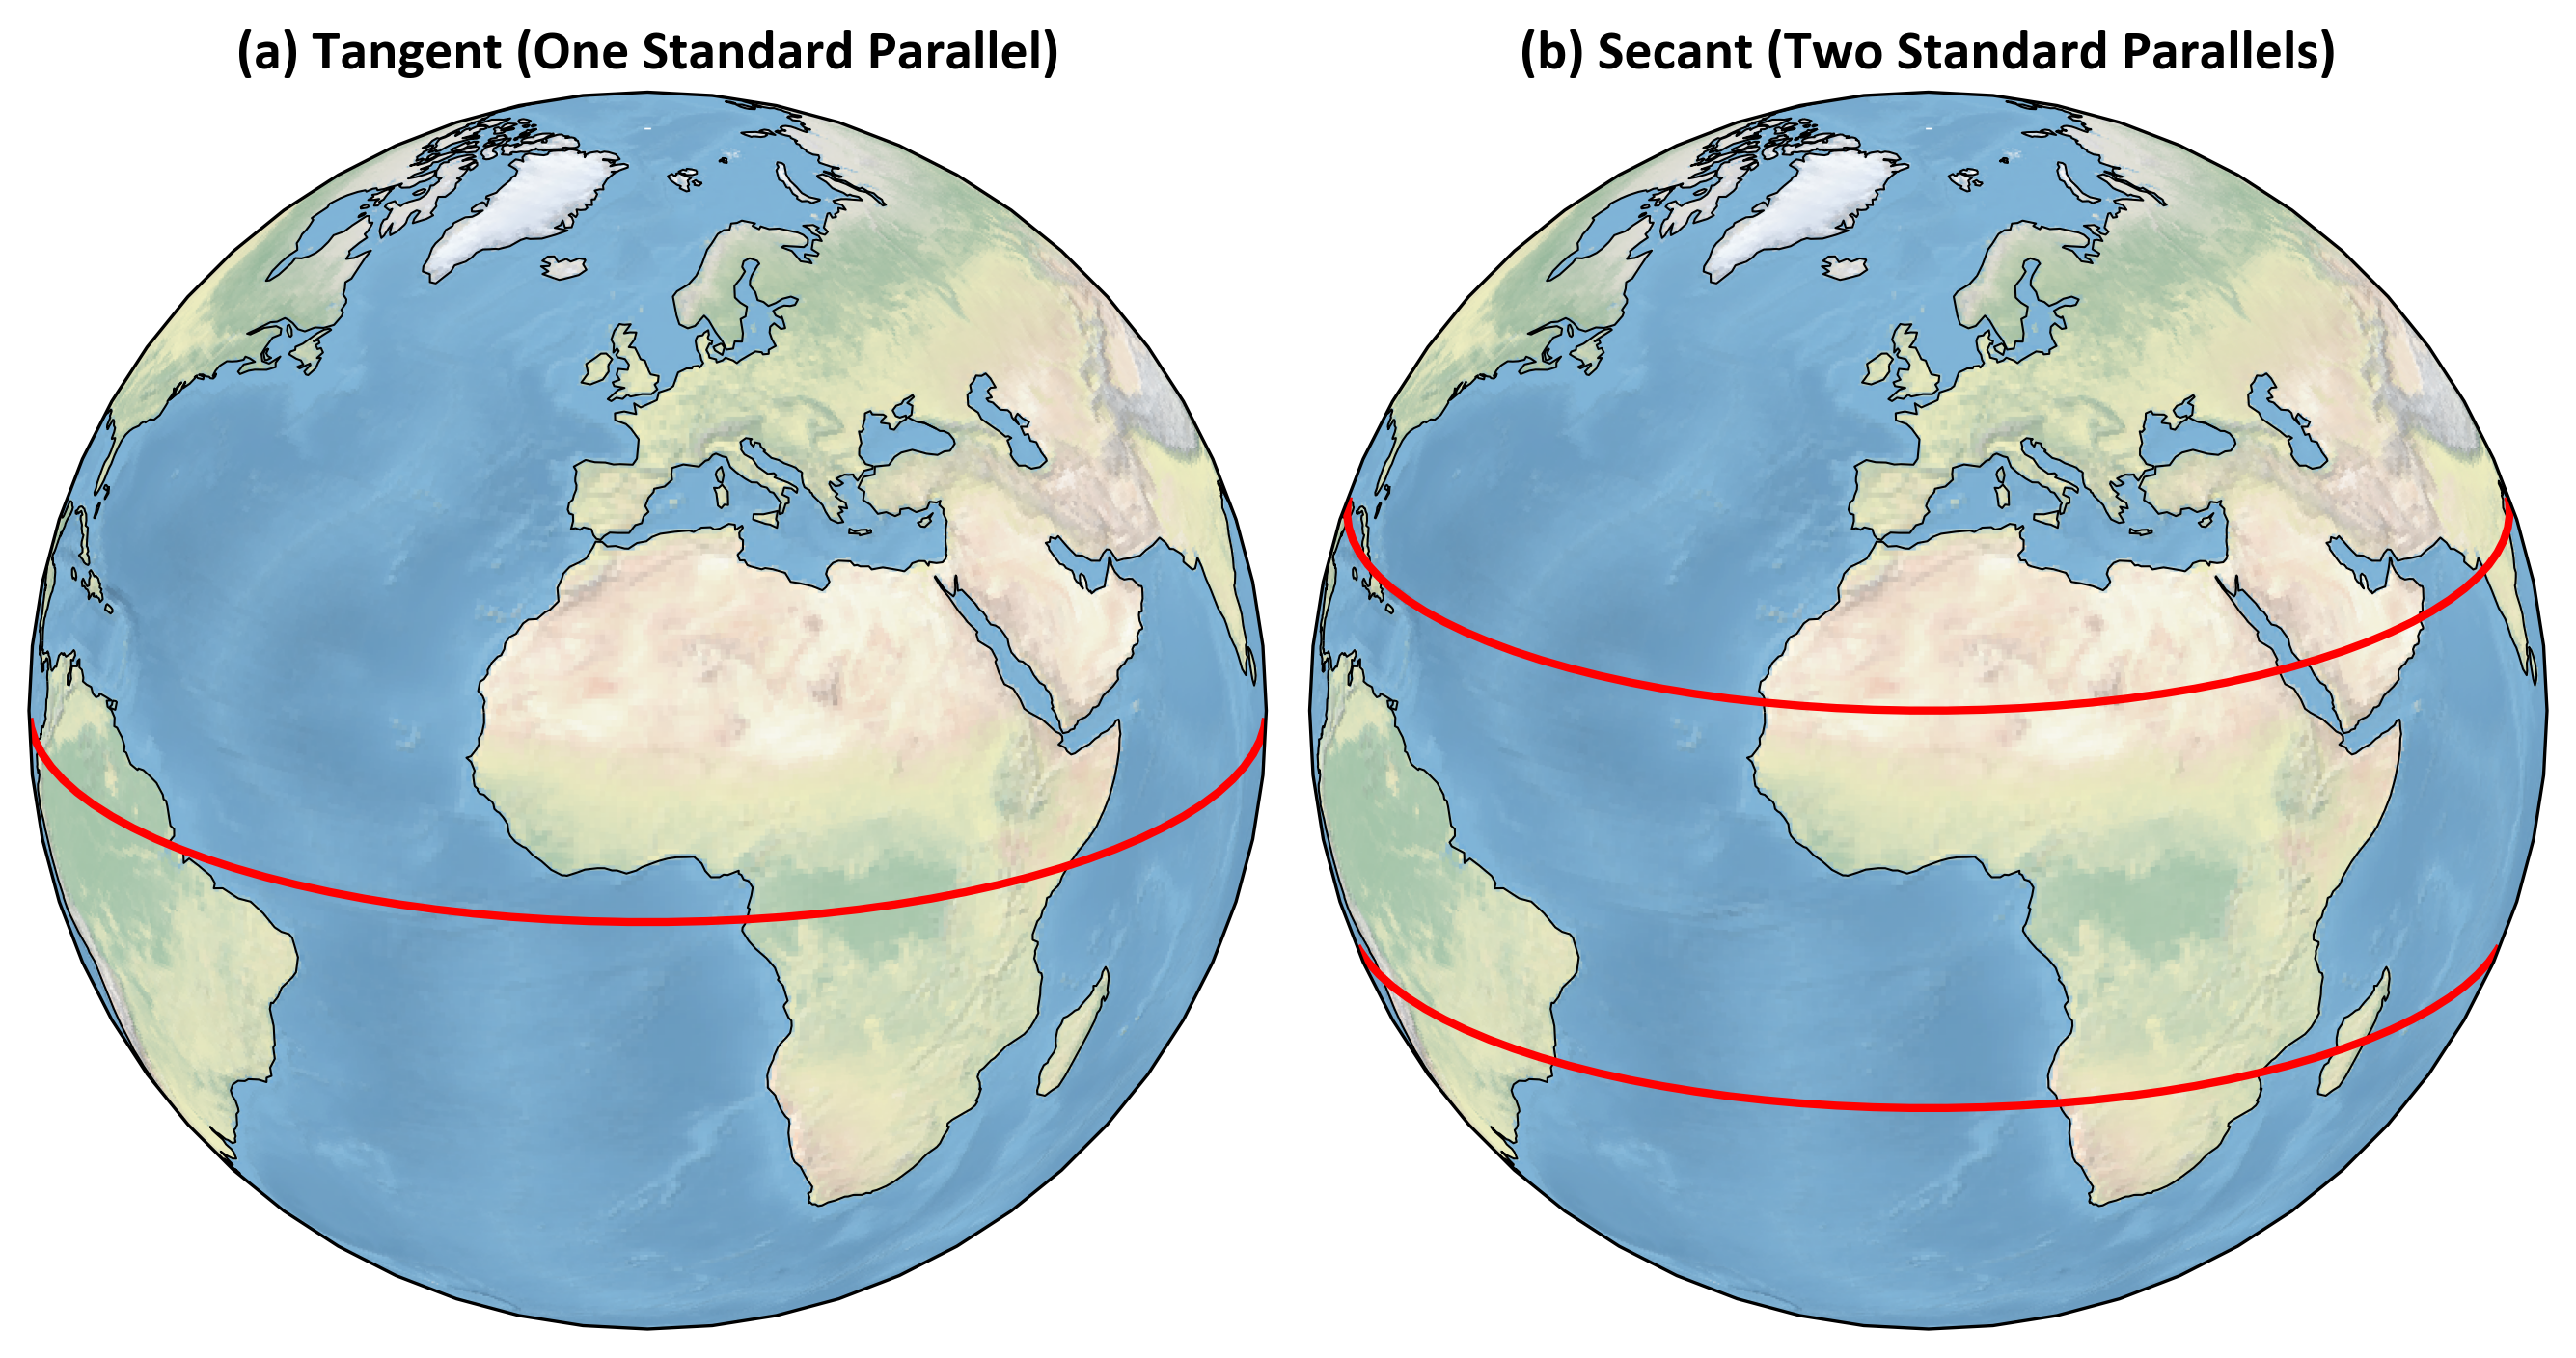
Fig. 2.19 Illustration of Tangent and Secant Projection Methods on a Globe. (a) Tangent Method: The projection surface touches the globe at a single line of tangency, in this case, the Equator (0° latitude). This method minimizes distortion at the point of tangency but increases distortion as you move away from this line. (b) Secant Method: The projection surface intersects the globe at two standard parallels, located at ±20° latitude. This method distributes distortion more evenly across the map, reducing the overall distortion compared to the tangent method.#
Fig. 2.20 illustrates these concepts for cylindrical, conic, and azimuthal projections, depicting both tangent and secant cases where applicable.
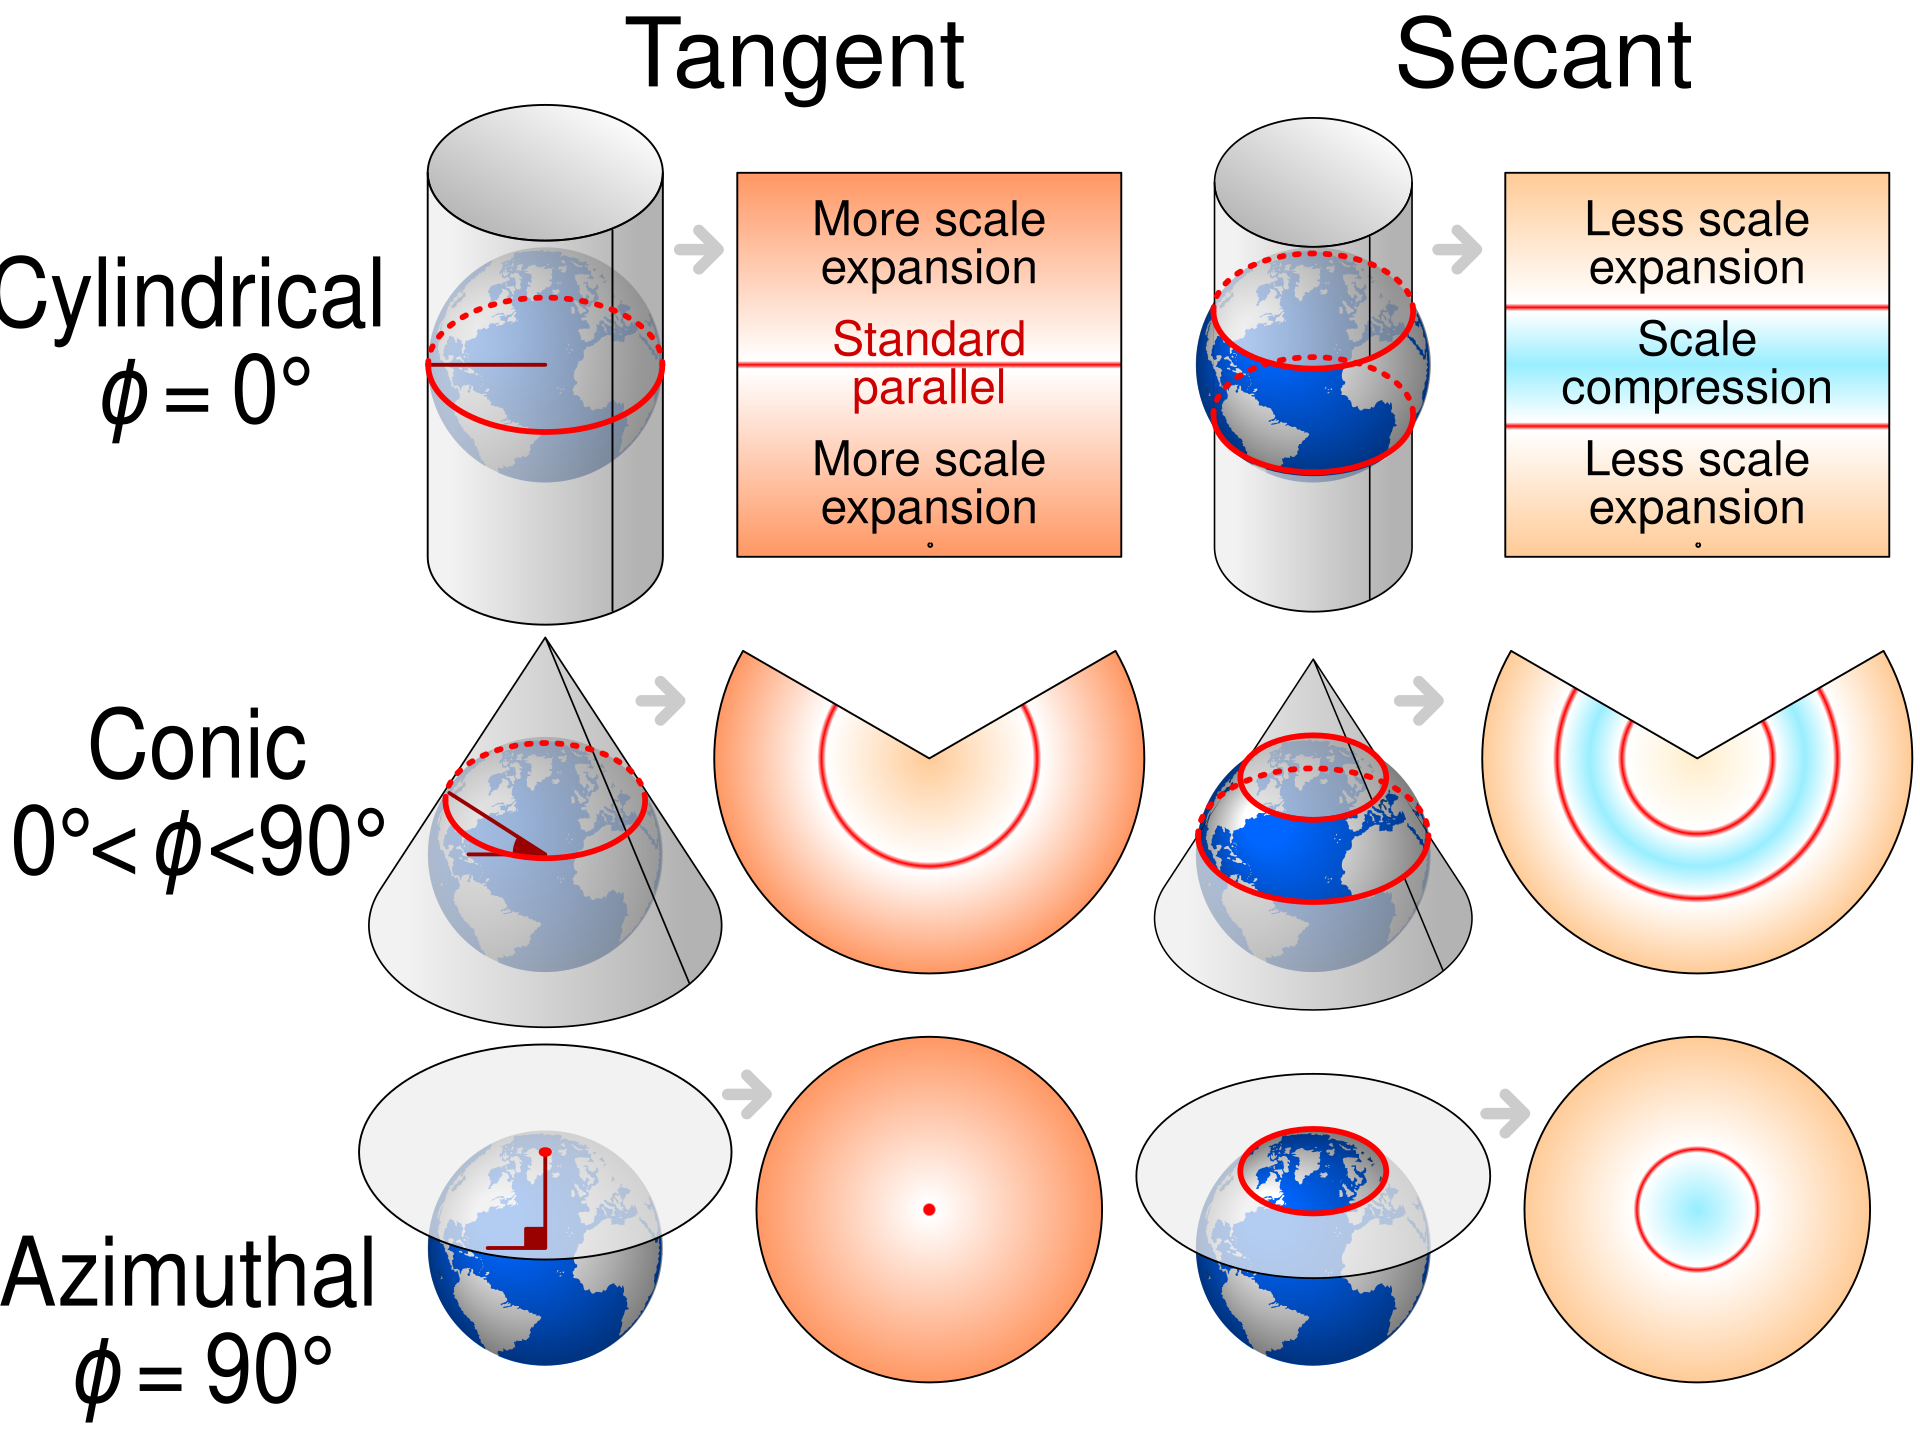
Fig. 2.20 Different Map Projections: Cylindrical, Conic, and Azimuthal. Credit: Wikipedia.org. Link to Image.#
2.4.5. Impact on Map Distortions#
The choice between tangent and secant methods significantly influences the distribution of distortions across a map. Map projections can distort area, shape, distance, and direction, and each method affects these distortions differently [Jenny et al., 2017, Kumar et al., 2023, McHaffie et al., 2023, Snyder, 1987, Wikipedia, 2024]:
Area Distortion: Secant projections generally result in less overall area distortion than tangent projections. In a secant projection, areas between the lines of intersection are slightly compressed, while areas outside these lines are slightly expanded. This balance leads to a more even distribution of area distortion across the map.
Shape Distortion: Tangent projections preserve shape accuracy along the line of tangency, but shape distortion increases rapidly as you move away from this line. In contrast, secant projections reduce shape distortion along two lines of intersection, offering a broader region with minimized shape distortion.
Distance Distortion: Tangent projections provide the most accurate distances along the line of tangency. Secant projections offer true scale along two lines of intersection, leading to more accurate distance measurements over a larger area of the map.
Direction Distortion: Both methods can impact directional accuracy, but secant projections tend to provide more consistent directional relationships across the map due to the more even distribution of distortions.
The secant method’s ability to distribute distortions more evenly makes it particularly advantageous for large-scale maps or when overall accuracy across the entire map is prioritized over perfect accuracy in a specific region [Bugayevskiy and Snyder, 2013]. However, for specialized applications focused on a narrow band of latitude, a tangent projection might still be preferred for its superior accuracy along the line of tangency.