7.3. Matplotlib interfaces#
It provides both a MATLAB-style interface and an object-oriented interface for generating plots. Let’s briefly explore each of these interfaces:
7.3.1. MATLAB-style Interface#
The MATLAB-style interface in matplotlib is inspired by the way plotting is done in MATLAB. It is convenient for users familiar with MATLAB’s plotting syntax. In this style, you can create plots directly without explicitly creating Figure and Axes objects [Pajankar, 2021, Matplotlib Developers, 2023].
Here’s an example of the MATLAB-style interface in matplotlib:
import matplotlib.pyplot as plt

# Use the custom style
plt.style.use('mystyle.mplstyle')

# Data
x = [1, 2, 3, 4]
y = [10, 20, 15, 25]

# Simple plot using MATLAB-style interface
plt.figure(figsize=(6, 4))  # Set the figure size
plt.plot(x, y)
plt.xlabel('X-axis')
plt.ylabel('Y-axis')
plt.title('Simple Plot', weight = 'bold')
plt.grid(True)
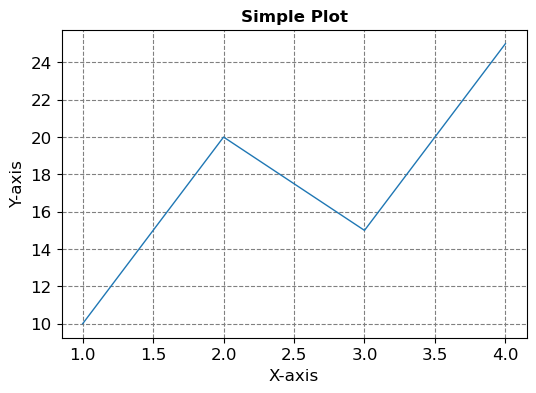
In this style, the plt module is used to create and customize the plot, and the various plot settings are directly applied to the active plot.
7.3.2. Object-oriented Interface#
The object-oriented (OO) interface in matplotlib is more explicit and provides fine-grained control over the plot elements. It involves explicitly creating Figure and Axes objects, allowing you to work with them separately (Vanderplas, 2016).
Here’s an example of the object-oriented interface in matplotlib:
# Data
x = [1, 2, 3, 4]
y = [10, 20, 15, 25]

# Create Figure and Axes objects
fig, ax = plt.subplots(figsize=(6, 4))

# Plot using object-oriented interface
ax.plot(x, y)
ax.set_xlabel('X-axis')
ax.set_ylabel('Y-axis')
ax.set_title('Simple Plot', weight = 'bold')
ax.grid(True)
In this style, you explicitly create a Figure using plt.subplots() and then work with the Axes object (referred to as ax in this example) to plot and customize the elements.
7.3.3. Similarities and differences#
Some of the similarities and differences between the MATLAB-style interface and the object-oriented interface in Matplotlib [Pajankar, 2021, Matplotlib Developers, 2023]:
Similarities:
Creating Visualizations: Both interfaces allow you to create a wide variety of visualizations, catering to different data representation needs.
Plot Customization: Whether using the MATLAB-style or object-oriented interface, you can customize aspects such as titles, labels, colors, markers, and axes properties.
Data Visualization: Both interfaces are designed to visually represent data patterns, trends, and relationships, enhancing data understanding.
Access to Matplotlib Functions: Regardless of the chosen interface, you have access to the same underlying Matplotlib functions and capabilities. This consistency ensures you can achieve similar results using either approach.
Widespread Usage: Both interfaces are widely used within the Matplotlib community, and resources such as tutorials and examples are available for both approaches.
Differences:
Syntax and Approach:
MATLAB-style Interface: This interface employs a syntax reminiscent of MATLAB. It’s concise and suitable for quick plotting without the need to explicitly manage Figure and Axes objects.
Object-Oriented Interface: This approach involves creating explicit Figure and Axes objects. It provides greater control and flexibility over plot components, making it suitable for complex plots and advanced customization.
Figure and Axes Management:
MATLAB-style Interface: The interface automatically manages the creation of figures and axes behind the scenes, which is advantageous for quick plotting.
Object-Oriented Interface: In this approach, you explicitly create and manipulate Figure and Axes objects, offering more control over subplot arrangements and component placements.
Complex Customization:
MATLAB-style Interface: While you can customize plots, the level of customization is somewhat limited compared to the object-oriented approach.
Object-Oriented Interface: This approach allows for more intricate customization, making it ideal for creating complex layouts, multiple subplots, and specialized visuals.
Transition from MATLAB:
MATLAB-style Interface: If you’re familiar with MATLAB’s plotting, transitioning to the MATLAB-style interface might be smoother.
Object-Oriented Interface: It’s a departure from MATLAB’s syntax, but it offers advantages in terms of flexibility and control.
Use Cases:
MATLAB-style Interface: Well-suited for quick exploratory data analysis and simple visualizations.
Object-Oriented Interface: Preferable for advanced customization, complex layouts, and precise control over plot components.
Summary
In summary, the choice between the two interfaces depends on factors like familiarity with MATLAB, the complexity of your visualizations, and your preference for either quick plotting or advanced customization. It’s also worth noting that you can mix and match both approaches within a single project, depending on the specific requirements of each plot.
Both the MATLAB-style and object-oriented interfaces are valid ways to work with matplotlib. The choice between the two often comes down to personal preference and the complexity of the plot you’re creating. The object-oriented interface is particularly useful when you want to create multiple subplots or customize the plot elements in a more detailed manner.